

1 Discrete and continuous data
Discrete data is information that can only take certain values. These values don’t have to be whole numbers (a child might have a shoe size of 3.5 or a company may make a profit of £3456.25 for example) but they are fixed values – a child cannot have a shoe size of 3.72!
The number of each type of treatment a salon needs to schedule for the week, the number of children attending a nursery each day or the profit a business makes each month are all examples of discrete data. This type of data is often represented using tally charts, bar charts or pie charts.
Continuous data is data that can take any value. Height, weight, temperature and length are all examples of continuous data. Some continuous data will change over time; the weight of a baby in its first year or the temperature in a room throughout the day. This data is best shown on a line graph as this type of graph can show how the data changes over a given period of time. Other continuous data, such as the heights of a group of children on one particular day, is often grouped into categories to make it easier to interpret.
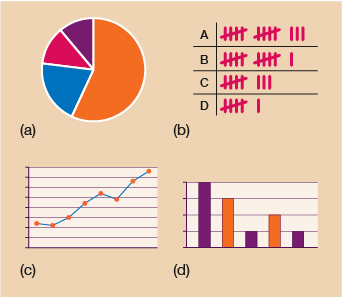
Activity 1: Presenting discrete and continuous data
Match the best choice of graph for the data below.
Chart to show a company’s profit over a number of years.
Chart to show favourite drink chosen by customers in a shopping centre.
Chart to show the temperature on each day of the week.
Chart to show percentage of each sale of ticket type at a concert.
Answer
Chart to show a company’s profit over a number of years.
The best choice here is (d) the bar chart as it can show the profit clearly year by year.
Chart to show favourite drink chosen by customers in a shopping centre.
The best choice here is (b) the tally chart since you can add to this data as each customer makes their choice. A bar or pie chart would also be suitable.
Chart to show the temperature on each day of the week.
The only choice here is (c) the line graph as it shows how the temperature changes over time.
Chart to show percentage of each sale of ticket type at a concert.
The best choice here is probably (a) the pie chart since it shows clearly the breakdown of each type of ticket sale. A bar chart would also represent the data suitably.
Now that you are familiar with the two different types of data let’s look in more detail at the different types of chart and graph; how to draw them accurately and how to interpret them.
Summary
In this section you have:
learned about the two different types of data, discrete and continuous, and when and why they are used.