

4.2 Interpreting pie charts
Imagine you’ve been presented with the pie chart below. The chart shows the ages of students competing at an athletic event.
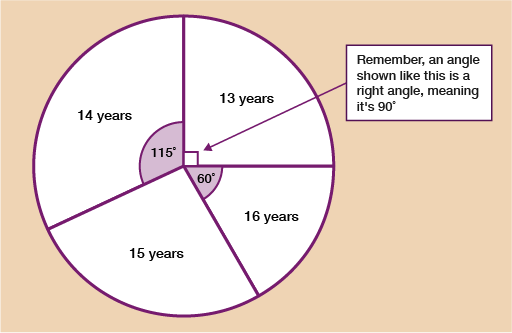
There are two possible pieces of information you could be given. You could be given the total number of students that were at the event, or, you could be given the number of students in one of the age categories.
Example: Reading a pie chart 1
Let’s say you were told that 72 people attended the competition. Since you know that 360˚ has been shared equally between all 72 people, you do 360 ÷ 72 = 5˚ per person.
Once you know this, if you wanted, for example, to know how many students that took part were 16 years old, you would look at the degrees on the chart for 16-year-old’s which in this example is 60˚.
You would do 60 ÷ 5 = 12 students.
If you wanted to work out the number of 15-year-olds, you would first need to work out the missing angle; you know that all the angles will add up to 360˚ so just do:
360 – 115 – 90 – 60 = 95˚
And now do the same as before 95 ÷ 5 = 19 students who were 15 years old.
Example: Reading a pie chart 2
Using the same pie chart, let’s say that all you were told was that 23 students took part who were 14 years old.
You can see that the angle for 14-year-olds is 115˚ and you’ve been told that this represents 23 students.
To find out how many degrees each student gets, you do 115 ÷ 23 = 5˚ per student.
Once you know this you can find out how many students are represented by each other section in the same way as we did in example 1. For example, the 13-year-olds have an angle of 90˚.
To find out how many there are you do 90 ÷ 5 = 18 students who were 13 years old.
Pie charts are very similar to ratio. In ratio questions you are always looking to find out how much 1 part is worth, in pie chart questions, you are looking to find how many degrees represents 1 person (or whatever object the pie chart is representing).
As well as being closely linked with ratio, pie charts also involve the use of your fractions skills. If, for example, you were asked what fraction of the students were 16 years old, you can show this as since the 16-year-olds are 60 degrees out of the total 360 degrees.
Using your fractions skills however, the fraction can be simplified to
It’s time for you to practise your skills at interpreting pie charts. Have a go at the activity below and then check your answers with the feedback given.
Activity 6: Interpreting pie charts
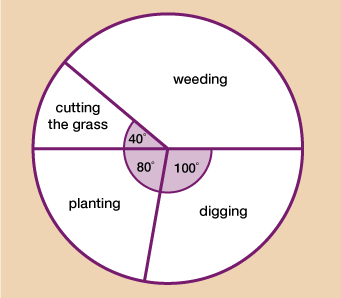
The pie chart below shows how long a gardener spent doing various activities over a month.
a.What fraction of the time was spent planting? Give your answer in its simplest form.
b.5 hours were spent digging. How long was spent on cutting the grass?
Answer
a.Planting = = in its simplest form.
b.Digging is 100˚ and you know that that was 5 hours. 100˚ ÷ 5 = 20˚ for each hour.
Since cutting the grass has an angle of 40˚, you do 40 ÷ 20 = 2 hours cutting the grass.
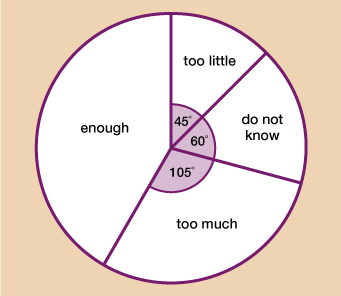
120 adults participating in an online course were asked if they felt there were enough activities for them to complete throughout the course. The pie chart below shows the results.
a.What fraction of the adults thought there were too many activities? Give your answer in its simplest form.
b.How many adults thought there were enough activities?
Answer
a.Too much = = in its simplest form.
b.You know that 120 adults took part in the survey. To find out how many degrees represents each adult, you do 360 ÷ 120 = 3 degrees per person.
Next you need to know the angle for those who said there were enough activities. For this, you do:
360 – 105 – 60 – 45 = 150˚
Now you know this, you can do: 150 ÷ 3 = 50 adults thought there were enough activities.
Well done! You can now draw and interpret bar charts and pie charts; both of which are good ways to represent discrete data. In the next part of this session, you will learn how to draw and interpret line graphs.
Summary
In this section you have learned:
what types of information can be represented effectively on a pie chart
how to use and interpret a pie chart
how to draw an accurate pie chart when given a set of data.