Session 5: Reasoning with sets
Introduction
In Session 3 you read about the book Thinking, Fast and Slow. The author Daniel Kahneman argues that we often replace questions by simpler ones that can be answered with less effort. The book draws on research that Kahneman and his collaborator Amos Tversky carried out over several decades.
One of their most famous experiments involved giving subjects the following scenario.
Linda is 31 years old, single, outspoken and very bright. She majored in philosophy. As a student, she was deeply concerned with issues of discrimination and social justice, and also participated in anti-nuclear demonstrations.
The subjects were then asked:
Which is more probable?
- Linda is a bank teller.
- Linda is a bank teller and is active in the feminist movement.
Most people choose option 2 as the correct answer. You can probably see why. Intuitively, you can hear an inner voice shouting that option 2 fits the description of Linda better. However, the question asks which option is most likely, and the correct answer is 1.
Bank tellers (clerks) who are also active in the feminist movement are a subgroup of bank tellers as a whole. There are fewer people in this subgroup than there are bank tellers altogether. So the probability of being a bank teller who is active in the feminist movement must be less than the probability of being a bank teller, whether they are active in the feminist movement or not.
In this session you will learn about a way of visualising the situation in the form of an Euler diagram. These diagrams are powerful aids to understanding many problems involving sets – collections of objects or people that share some property.
An Euler diagram represents sets as ovals. Relationships between sets are shown as relationships between the corresponding ovals.
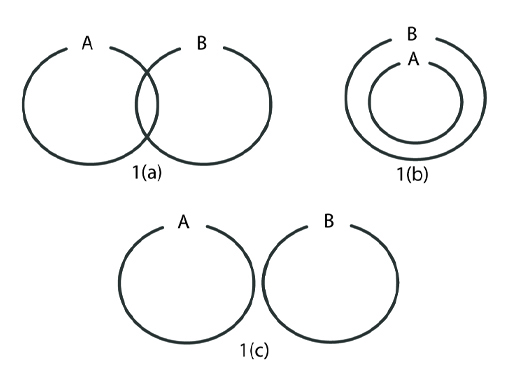
For example Figure 1 (a) shows two sets A and B which have some objects in common, so the ovals are shown overlapping. This is the idea of intersection.
In Figure 1 (b) set A is in set B, so every object that belongs to set A is also in set B, and this is shown by the oval that represents A being inside the one representing B. This is the idea of inclusion.
In Figure 1 (c) sets A and B have no objects in common, and in this case the two ovals are shown with no overlap.
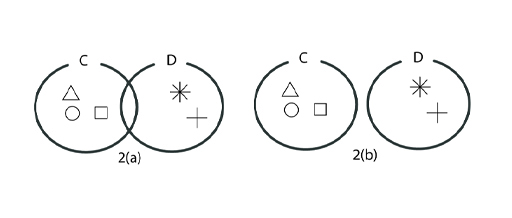
Euler diagrams bear some resemblance to Venn diagrams, another common way of showing sets graphically, but there is a crucial difference between the two. Any region in a Euler diagram corresponds to a set that actually contains objects, whereas a Venn diagram shows all potential combinations, irrespective of whether or not they are empty.
So in Figure 2 the same two sets C and D are shown first as a Venn diagram, and then as an Euler diagram. The Venn diagram shows an overlap, but because there are no objects common to C and D the intersection is empty. In the Euler diagram the fact there are no common elements is represented directly by the two ovals not overlapping.
In this session you will also learn about sets in Python, and then go on to explore some more ways in which System 1 heuristic thinking can lead to mistaken conclusions. This will involve thinking about the size of different sets. Python will be used to do some simple experiments that simulate random events.
By the end of this session, you will be able to:
- use Euler diagrams as a tool for reasoning about sets
- understand operations on sets
- carry out simple set operations using Python
- use Euler diagrams to reason about the size of sets and calculate simple probabilities
- see how Euler diagrams can help to understand the counterintuitive answers to some well-known questions, such as Linda the bank teller, the law of small numbers, and the false positive paradox.


