1.2 The risk-free rate
Investors expect to be rewarded for taking on extra risk. However, even if an investment is free of risk, investors still require a reward. This is to compensate for time preference and to include an element for expected inflation. The ‘real’ rate of return is the rate of return investors require after allowance has been made for expected inflation.
The nearest thing to a completely risk-free investment is a government security, such as a short-term Treasury bill (with a maturity of up to one year) or longer-term government bonds. Lending to a government is generally (but not universally) free of the risk that the investor will not receive either the interest or the capital when the loan comes to be repaid. This reflects the fact that most governments do not need to default on their domestic debt (i.e. debt denominated in the currency of that country) – they can just create more money to repay investors (this is obviously not true for the countries that have joined the eurozone). For heavily indebted governments, too much money creation may cause high inflation, and therefore reduce the real value of the bond repayments. So, although the debt may be repaid in full, there is no guarantee that the real rate of return will be as high as was initially expected.
Stop and reflect
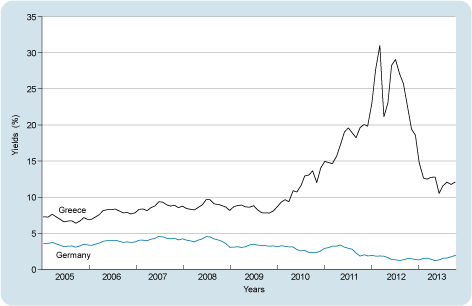
Look at Figure 3 that shows Greece’s borrowing costs relative to Germany’s during the period 2005–13. Why did the cost of Greek debt become much higher than the cost of German debt?
Greece is a member of the eurozone. Before it joined, it issued bonds in its own currency, the Greek drachma, and repaid as it wished using its own currency. In 2010, Greek government debt was denominated in euros but the Greek government did not have control over this currency. No individual government in the eurozone has the right to issue unlimited amounts of euros – the currency is ‘owned’ by the participating states as a group.
Figure 3 shows the returns (yields) required by investors for lending for ten years to the Greek or German governments (2005–13). Up to mid-2008, there was barely any difference between the two government yields. From 2008 onwards, the perceived risk of Greek government bonds was higher than for German government bonds and investors began to require higher yields on Greek bonds. By early 2010, there was a real risk that Greece would have to default on its debt, as the economic recession had reduced the Greek government’s income. Investors raised the amount they required to lend to the Greek government dramatically to well above the amount required to lend to the German government (even though Germany also uses the euro and is part of the eurozone). In May 2010, the International Monetary Fund (IMF)* and the eurozone countries agreed a €110bn loan to Greece. This did not have any significant dampening effect on long-term Greek government bond yields. These yields kept on rising until February 2012 when a debt ‘haircut’ deal - a writing down of the face-value of Greek bonds - of €206bn, accompanied by a second bailout package (a new €100 billion loan and a retroactive lowering of the bailout interest rates), was agreed. Investors were asked to write off 53.5% of the face value of the Greek sovereign bonds they were holding.
* The International Monetary Fund (IMF) describes itself as an organisation of 187 countries, working to foster global monetary cooperation, secure financial stability, facilitate international trade, promote high employment and sustainable economic growth, and reduce poverty around the world. For more information, go to www.imf.org/ external/ about.htm [Tip: hold Ctrl and click a link to open it in a new tab. (Hide tip)] .
Treasury bills can be considered to be the safest investments available on the international capital markets, given the credit-worthiness of (most) governments, their short-term nature and the fact that they can be easily bought and sold. As you saw in earlier, the returns offered on investments include an element for expected inflation. If inflation turns out to be lower or higher than expected, investors will earn more or less in real terms than they expected. This is known as inflation risk. The short maturity of Treasury bills, however – one, three, six or even 12 months – minimises the likely difference between actual and expected inflation and hence their inflation risk is almost nil.
Treasury bills in most countries are traded in large nominal amounts. In the UK, the minimum nominal amount is £500,000.
The return offered on Treasury bills can be considered to be almost a risk-free rate and the minimum required rate of return for all investors. All other securities are considered to be riskier than Treasury bills, in the sense that they are more volatile in their price movements (i.e. they have a higher standard deviation of returns) or they carry a greater risk that the borrower will not repay the debt. These securities should offer investors an expected rate of return at least as high as the return offered on Treasury bills.
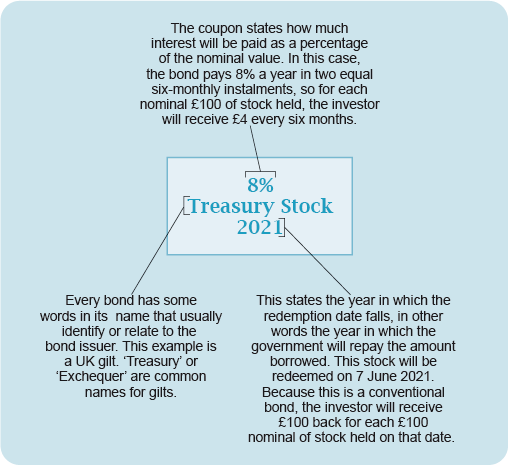
An alternative estimate of the risk-free rate of return is obtainable on long-term government bonds. This definition is often preferred by managers when determining a benchmark risk-free rate because, they argue, they are typically looking at long-term projects and their investors are looking to invest over the long term. Over longer periods, an investor’s risk-free alternative would be to invest in a government bond of the same maturity as their desired holding period and earn a promised yield to maturity. Figure 4 explains how to understand UK government bond terminology, such as the interest paid on the bond (known as the coupon), its title and its maturity or redemption date.
UK government bonds are called gilts – the certificates used to be gilt-edged and as the UK government has never defaulted on a debt, they can be considered as secure as gold!
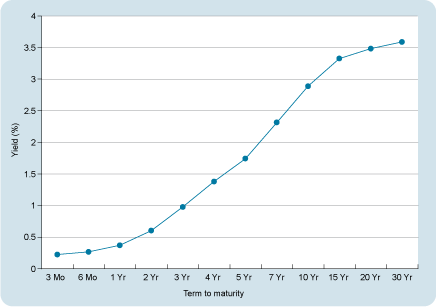
Treasury bills and long-term government bonds can be considered essentially risk free. Note, however, that the return expected from a Treasury bill is likely to differ from the return expected on, say, a 20-year government bond, since investors require different returns on investments with different maturities. These different returns are often described as the term structure of interest rates and can be shown graphically in what is called a yield curve, where the yield on the y-axis (or vertical) is plotted against maturity on the x-axis (or horizontal).
Remember that all yields or interest rates are given on an annualised basis for ease of comparison. In the text, p.a. stands for per annum.
Figure 5 shows the yield curve for UK government bonds, or gilts starting at three months and stretching out to 30 years at a particular point in time (in this case, 16 December 2013). So, on that day, investors required only just over 20 basis points (or just over 0.20% since there are 100 basis points in one percentage point) for lending for three months to the UK government. In contrast, investors required 2.89% p.a. for lending for 10 years, 3.48% p.a. for lending for 20 years and 3.59% p.a. for lending for 30 years. This means that, the longer the maturity of the bond (i.e. the further away its redemption date), the higher the annual rate of return or yield to maturity that they require. This is called a rising yield curve.
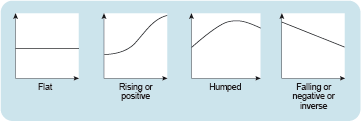
Yield curves can be flat, rising, humped or falling depending on investors’ expectations about the future levels of interest rates. Figure 6 shows the alternative yield curves. The simplest way to explain why there are different shapes of yield curve is to do with expectations, the so-called expectations hypothesis. For example, if investors expect rates to go up in the future, the yield curve will be rising; if investors think they will go down, the yield curve will slope downwards. Flat yield curves are due to an expectation that interest rates will remain unchanged. However, supply and demand also influence yield curves. For example, if there is demand from banks for short-term government bonds and demand from long-term investors such as pension funds for long-term government bonds, there may be a lack of demand for bonds of medium maturity – say five to ten years. In such a case, the yield curve might well be humped, with the highest yields available on medium maturity bonds.
Stop and reflect
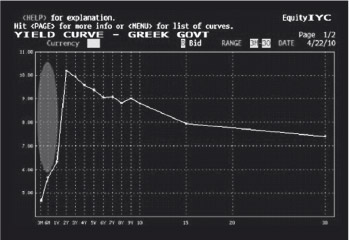
What do you think the yield curve would look like for a country with financial problems and a higher risk of default than the UK (for example, Greece before the rescue package in May 2010)?
The shape of the curve depends on when you take your snapshot. Figure 7 shows the yield curve for Greece on 22 April 2010 just before the rescue package was announced in early May. In such a severe crisis situation, the curve was falling; one to three-year bonds had a much higher yield than, say, 30-year bonds. Greece was either expected to default in the short term or survive and improve.
We will now examine the second element of the required rate of return on a single share: the equity risk premium.

