

1.1 Extracting meaningful information
One limitation of financial statements is that they only show absolute figures relating to a particular accounting period of normally two years (the latest annual figures as well as the previous ones). It is much more informative for users of accounts to have comparative information that gives much more context to the figures in the financial statements. Such information may be how financial results compare between companies in the same industry or how a company’s results compare with expected figures.
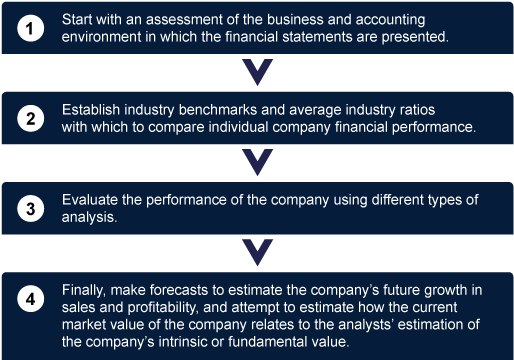
Analysts (in this course, anyone engaged in the analysis of financial statements is referred to as an analyst) will usually use the following steps when analysing financial statements:
If the analyst thinks that the market value of the company is higher than its intrinsic value, it may be time to sell the shares. On the other hand, if the analyst thinks that the intrinsic value is higher than the market value, it means their expectation is the share price will probably rise, so there is a possibility of making a profit by buying the shares now and selling them later.
In practical terms, ratios provide highly useful information to analysts for making important financial decisions. However, do note that any analysis produced just by looking at the ratios of an organisation in one year will not necessarily provide a good insight into its financial and operational health.