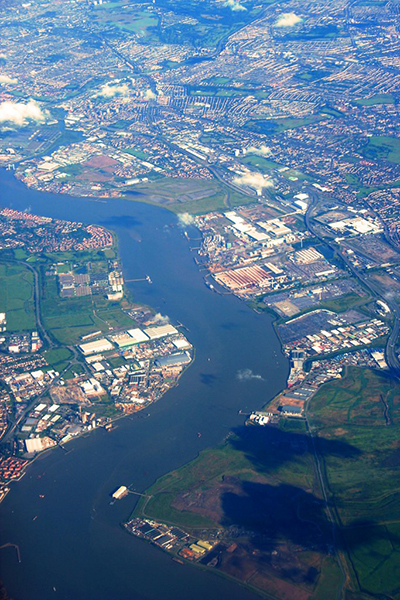
Sea level rise will have effects around the coast of the UK, from major cities such as London to many smaller villages and towns. One place which is in the frontline of present and future sea level rise is London, the capital of the UK.
 The Thames and London
Why is the sea level rising?
Global sea-level rise is caused by the melting of ice sheets in Greenland and Antarctica and the expansion of seawater as it heats up (Humphreys, 2019a). Over the period 1901-2010 global average sea levels rose 0.19 metres (IPCC, 2013). Predictions for future sea-level rise vary. The impact on varying levels of sea-level rise in different locations can be explored by looking at this map.
London’s vulnerability to sea-level rise
London has always been vulnerable to the sea as the Thames is tidal and high tides bring increased water levels to the river in the city. The high tide level of the Thames has risen over time and the risk from tidal surges has increased. Tidal surges are caused by a combination of a high tide and strong winds which push water towards the land and up rivers. They affect London when a surge in the Atlantic, funnels down the North Sea, up the English Channel, and then up the Thames Estuary (Carbon Brief, 2014). From the evidence of the London Bridge high water mark, we know that the level has risen since 1780 by over 1.5 metres (Carbon Brief, 2014). Alongside ice melt increasing seawater volume other factors have important impacts on the changing sea level in London. Around 11,500 years ago ice sheets covering the north of the British Isles began to retreat. The land that had been covered continues to rise in response to the weight of the ice removed. As this rise occurs in the north a downward tilt occurs in the south. This means that as well as meltwater leading to sea level rise a relative rise occurs due to isostatic rebound as the land rises where it had been depressed by ice sheets.
In 1953 there was a catastrophic tidal surge. The flooding from the surge caused huge damage and cost 307 lives (RGS, 2020). It also caused an estimated £50 million (£5 billion in today’s money) (RGS, 2020) in damage and lost income to the city. The economic importance of London is a central factor in the government response to this issue.
How has London adapted to the challenge?
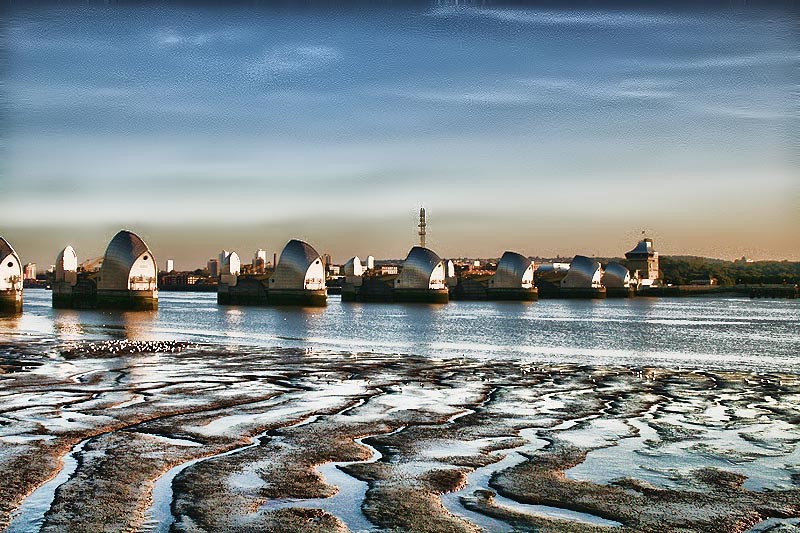
In 1953 the decision was taken to protect the city with a barrier downstream at Woolwich which could be closed when high tide was forecast. The Thames Barrier was completed in 1982. Without the barrier 48 square miles of London would flood: Southwark, West Ham and Whitechapel, as well as the Houses of Parliament and the Westminster area. The barrier also protects 1.25 million people, property worth £200 billion and infrastructure such as the underground rail system (RGS, Twentieth Century Challenges, 2020).
 The Thames Barrier
To watch a video of how the Thames Barrier works from the Environment Agency, click here.
London's economic value to the UK
London is central to the UK economy and as such is seen as a valuable asset. A major flood in 1953 with estimated costs of 1.2 billion at 2014 values (Wadey et al., 2015) led to calls for action. The weighing of costs of inaction i.e. no further protection, and action i.e. spending on further protection measures, has resulted in the UK government prioritizing cities such as London because they deliver high economic value to the economy. This prioritizing of some places over others in the UK means that populations in centres such as London are protected, whereas populations in small, poorer areas of the UK such as coastal villages and towns away from the cities are left vulnerable to future sea-level rise. Economic aspects of society are often given precedence in policymaking over social and environmental aspects.
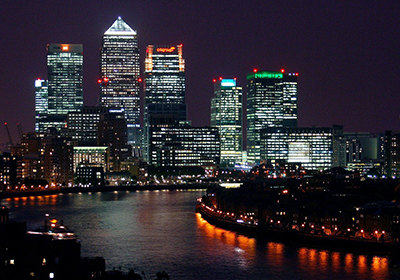
 Canary Wharf - a major financial district in London
The future for London?
The Thames Barrier was not intended to protect against sea-level rises caused by climate change (Humphreys, 2018). When it came into being it was expected to be used 2-3 times per year. That rate of use has increased in the 2000s and the current yearly average is 6-7 times (UNESCO, 2020). As the effects of climate change continue to create higher sea levels and increased storms the Barrier will not be enough to protect London. Therefore, a new plan for protection has been devised by the Environment Agency.
The new plan for adaption is the Thames Estuary Plan. This contains protection strategies for the short-term (15 years) and the medium and long-term (until the end of the 21st century), because of the continuing and increasing effects of climate change in the 21st century. All forecasts predict sea-level rise, but these do vary, creating uncertainty. Scientific analysis of the effects of climate change is considered very important in government policymaking but this is difficult because there inevitably there is a range of predictions in sea level rise (Humphreys, 2019b). Therefore, the Thames Estuary 2100 plan considers all climate change scenarios (Gov.UK, 2020) and builds in the uncertainties. #


Rate and Review
Rate this article
Review this article
Log into OpenLearn to leave reviews and join in the conversation.
Article reviews