

3 The logarithmic scale
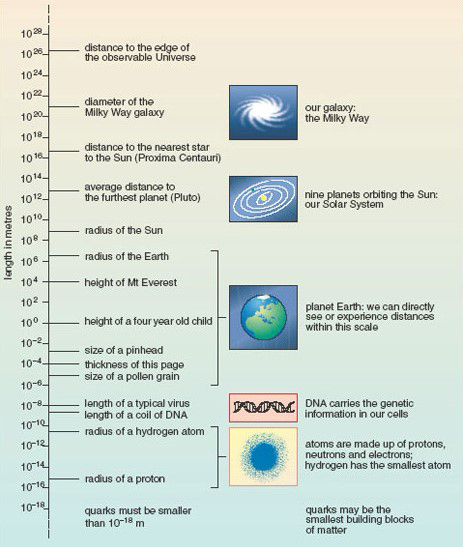
Sophisticated instrumentation now allows scientists to measure across 40 orders of magnitude, as shown in Figure 2. If you look back at Figure 1 [Tip: hold Ctrl and click a link to open it in a new tab. (Hide tip)] , you will see that the horizontal scale is quite different to that of the vertical scale in Figure 2. On each line of Figure 1, the interval between marked points was always the same with, on the top line for example, marked points at −100, 0, 100, 200, etc. In other words, each step from one division to the next on the scale represented the addition or subtraction of a fixed amount (100 in that case). This kind of scale is called linear. In Figure 2, on the other hand, each step up or down the scale involves multiplication or division by a fixed power of ten (102 in this case). As a result, the intervals between divisions are all different. This kind of scale is called logarithmic. Activity 3 allows you to investigate some of the properties of the scale used in Figure 2.
Activity 3 The logarthimic scale
(a) On Figure 2, what is the difference in value between:
- i.the tick marks at 10−2 m and 100 m;
- ii.the tick marks at 100 m and 102 m, and
- iii. the tick marks at 102 m and 104 m?
Answer
i.10−2 m = 0.01 m and 100 m = 1 m so the difference between them is (1 − 0.01) m = 0.99 m.
ii.100 m = 1 m and 102 m = 100 m, so the difference between them is 99 m.
iii.102 m = 100 m and 104 m = 10 000 m, so the difference between them is 9900 m.
It is quite clear that as one goes up the scale the interval between each successive pair of tick marks increases by 100 times.
(b) From Figure 2, calculate to the nearest order of magnitude:
- i.how many times taller than a child is Mount Everest;
- ii.how many typical viruses laid end to end would cover the thickness of a piece of paper. (Hint: you may find it helpful to look back at Worked example 2.)
Answer
- i.The height of a child is about 100 m, i.e. 1 m. The height of Mount Everest is about 104 m (actually 8800 m, but it is not possible to read that accurately from the scale on Figure 2). So Mount Everest is ~104 times taller than a child.
- ii. The length of a typical virus is 10−8 m and the thickness of the page is 10−4 m, so it would take ~10−4/10−8 = 10−4-(−8) = 10−4+8 = 104 viruses laid end to end to stretch across the thickness of the page.
In Figure 2, a logarithmic scale was used for the purposes of display, and the power of ten for the multiplying factor (102) was chosen because it was the one that best fitted the page. In drawing diagrams and graphs you are always free to choose the scale divisions. However, logarithmic scales are used in certain fields to measure quantities that can vary over a very wide range. In such cases, an increase or decrease of one ‘unit’ always represents a ten-fold increase or decrease in the quantity measured. Box 3 gives two examples.
Box 3 Logarithmic scales in practice
Sound waves
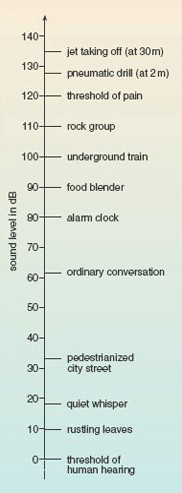
The decibel (symbol dB) is the unit used to measure the relative loudness of sounds. The ‘intensity’ of a sound is related to the square of the variation in pressure as the sound wave passes through the air, and the range of intensities that people can detect is enormous. The sound that just causes pain is 1012 times more intense than the sound that is just audible! To deal with this, a logarithmic scale for loudness was devised, according to which every 10 dB (or ‘1 bel’) increase in sound level is equivalent to a 10-fold increase in intensity. 1 dB is just within the limit of human hearing, and a change of 1 dB is about the smallest difference in sound that the ear can detect (see Figure 3).
Earthquakes
The Richter scale describes the magnitude of earthquakes and is a measure of the maximum ground movement caused by an earthquake. Some earthquakes can produce ground movements millions of times greater than the minimum detectable limit. To cope with this huge variation, the Richter scale is logarithmic: an increase of one unit on the scale implies a ten-fold increase in the maximum ground movement. A magnitude 3 earthquake produces 10 times more ground motion than a magnitude 2 earthquake.
Worked example 3
A whisper corresponds to a sound level of about 20 dB, and a shout to a level of about 80 dB. How much greater is the intensity of a shout compared to that of a whisper?
Answer
The increase in sound level is
80 dB − 20 dB = 60 dB
This maybe expressed as (10 dB + 10 dB + 10 dB + 10 dB + 10 dB + 10 dB), and each 10 dB increase corresponds to multiplying the intensity by 10.
So the intensity of a shout is (10 × 10 × 10 × 10 × 10 × 10) = 106 times greater than a whisper!
Now try this in the following activity.
Activity 4 Comparing logarithmic quantities
How much more ground movement is there in an earthquake measuring 7 on the Richter scale compared to one measuring 3?
Answer
Magnitude 7 on the Richter scale represents four points more than magnitude 3, and each point increase represents a factor 10 increase in maximum ground movement. So a magnitude 7 earthquake corresponds to 104 (i.e. 10 000) times more ground movement than a magnitude 3 earthquake.
With any measurement, whether based on a linear or logarithmic, it is important to know how precise they are. You will learn about precision in the next section.