

4 Mean and standard deviation for repeated measurements
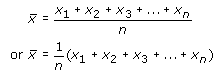
In everyday terms, everybody is familiar with the word ‘average’, but in science, technology and statistics there are actually several different kinds of average used for different purposes. In the kind of situation exemplified by Table 1, the sort to use is the mean (or more strictly the ‘arithmetic mean’). For a set of measurements, this is defined as the sum of all the measurements divided by the total number of measurements made.
Activity 1 Calculating the mean
What is the mean of the results in Table 1?
| Measurement | Cell constant/nm |
| 1 | 2.458 |
| 2 | 2.452 |
| 3 | 2.454 |
| 4 | 2.452 |
| 5 | 2.459 |
| 6 | 2.455 |
| 7 | 2.464 |
| 8 | 2.453 |
| 9 | 2.449 |
| 10 | 2.448 |
Answer
The sum of all the measurements is 24.544 nm. There are 10 results, so the mean value is , or 2.4544 nm to five significant figures. (The reason for giving the result to this number of significant figures will be discussed shortly.)
To turn this description of how to calculate a mean into a formula, each element has been allocated a symbol. So say that you have made n measurements of a quantity x. Then you can call the individual measurements x1, x2, x3, … xn (where x1 is properly said either as x ‘subscript one’ or as ‘x sub one’, but also sometimes as ‘x one’ e:
However, the sum is tedious to write out, so a special ‘summation’ sign, Σ (capital Greek letter sigma), is used to denote the adding up process, and the mean of n measurements can be neatly written as:
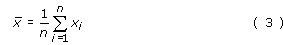
The i = 1 below the summation sign indicates that the first value for xi in the sum is x1, and the n above it indicates that the last value in the sum is xn. In other words, all integer values of i (x1, x2, x3, etc.) are to be included up to xn. (The summation sign with the information attached to it is usually said as ‘sum of x sub i from one to n’.)
You now want a quantitative way of describing the spread of measurements, i.e. the extent to which the measurements ‘deviate’ from the mean. There are 5 steps required to do this, which are laid out below, and Table 2 shows the results of following this ‘recipe’ for the data in Table 1.
Step 1
Calculate the deviation of each measurement. The deviation di of any individual measurement is defined as the difference between that measurement and the mean of the set of measurements:

Notice that the value of di may be positive or negative depending on whether a particular measurement is larger or smaller than the mean of the set of measurements.
At this stage the deviations have been expressed as decimal numbers.
Step 2
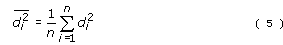
Calculate the squares of each of the deviations (i.e. di2). These will, of course, all have positive values.
By this stage the values have become very small so the column has been headed in such way that the numbers entered in the column represent the value of di2 divided by 10–5.
Step 3
Add together all the squares of the deviations i.e. ![]()
Step 4
Divide by the total number of measurements (i.e. n) to obtain the mean of all the square deviations. This may be written as:
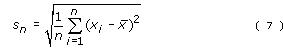
Step 5
Take the square root of this mean to obtain the ‘root mean square deviation’ sn. It is this quantity sn that is known as the standard deviation. Step 5 may be written as:

or, substituting for di2 from Equation 5, as:
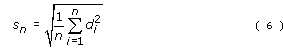
Since di was defined in Equation 4 as (xi–x̅) one final substitution into Equation 6 gives sn in its most easily used format:
The standard deviation sn for n repeated measurements of the same quantity x is given by
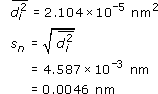
At the end of this process, you can summarize all the data in Table 1 just by saying that the ten measurements had a mean of 2.4544 nm and standard deviation 0.0046 nm. The calculation of standard deviation is given in Table 2.
There are several things worth noting about this result and the data in Table 2.
First, all the quantities have units associated with them. The values of xi were measured in nanometres, so deviations will also be in nanometres and the squares of the deviations in nm2, as shown in the column headings in the table.
| xi/nm | di/nm | di2/10–5 nm2 |
| 2.458 | 0.0036 | 1.296 |
| 2.452 | –0.0024 | 0.576 |
| 2.454 | –0.0004 | 0.016 |
| 2.452 | –0.0024 | 0.576 |
| 2.459 | 0.0046 | 2.116 |
| 2.455 | 0.0006 | 0.036 |
| 2.464 | 0.0096 | 9.216 |
| 2.453 | –0.0014 | 0.196 |
| 2.449 | –0.0054 | 2.916 |
| 2.448 | –0.0064 | 4.096 |
 | ||
A second useful feature to notice is that the sum of all the deviations is equal to zero.

If you are interested in knowing why this is always true, there is an explanation in Box 2 (though you do not need to work through the full explanation in order to make use of the result). At the end of Step 1 it is well worth adding up all the values you have calculated for the deviations to ensure that they do indeed total zero. If they don’t, you have made an arithmetic slip somewhere which needs to be put right before you proceed to Step 2.
Looking now at the details of the calculation, the original measurements of length were made to the nearest picometre (i.e. 0.001 nm), represented by 3 decimal places (i.e. 3 digits after the decimal point). More digits were carried in the calculations to avoid rounding errors. However, what is the appropriate number of digits to quote in the final answer? Well, when all the 10 results were added up in Table 1, this value was obtained
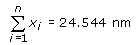
(i.e. 5 digits in total). This sum was divided by an exact number (10) so it is appropriate to retain 5 digits in the result of this division, giving x̅ as 2.4544 nm. It is therefore valid to retain one more decimal place in the mean value than in each of the measurements individually. After all the whole point of repeating the measurement many times and averaging is to improve confidence in the final result! Having quoted the mean as x̅ as 2.4544 nm, it then makes sense to quote the standard deviation as 0.0046 nm.
Box 2 The sum of the deviations is always equal to zero
It is quite easy to work out from first principles the reason for the sum of the deviations being zero in the special case in which the set consists of just two measurements, x1 and x2. The mean would then be:

so

And
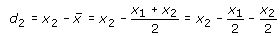
Therefore
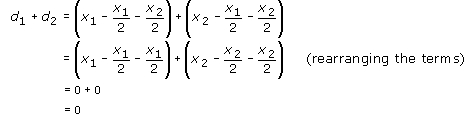
This argument can be extended to any number of values of x; as an exercise in algebra you might like to try it for three measurements. However many values of x are chosen, it is always the case that the sum of the deviations is zero.
The fact that here the standard deviation is quite small in comparison to the mean shows why, in this context, it is more sensible to think in terms of places of decimals rather than significant figures. Because leading zeroes do not count as significant, the standard deviation is actually only given to 2 significant figures, whereas the mean is given to 5. In such circumstances, it is easier to think of the mean and the standard deviation as being expressed to the same number of decimal places (always assuming of course that they are given the same units).
In summary, the easiest procedure is to give the mean to one more decimal place (or one more significant figure) than was used for each of the individual measurements, and then to quote the standard deviation to the same number of decimal places as the mean.
Even with a small number of values in a data set it is easy to make arithmetical mistakes when calculating the mean and standard deviation by hand. Most experimental data will consist of many more than 10 observations. The next section looks at what the tools you can use.