

4 Why not an exact 3:1 ratio?
Before we leave the maize breeding experiments we will look more closely at some actual values obtained for the F2 generation and how closely they fit the expected phenotypic ratio of 3:1. Table 2 gives the ratios of purple to white grains for eight cobs of the F2 generation, counted by members of the S103 Course Team.
Notice the variability of the results between cobs in Table 2. One of the most striking features of biological results is their variability. First, consider the total number of grains in each cob. None of the figures in the table is the 'right' answer; each set reflects the particular feature of the individual cob from which they were taken. Some of the cobs may have more grains than others because there were more female flowers and hence more ovules, or because a larger proportion of the ovules were fertilised.
| Total no. of grains | No. of purple grains | No. of white grains | Ratio of purple to white grains |
|---|---|---|---|
| 565 | 434 | 131 | 3.31:1 |
| 487 | 364 | 123 | 2.96:1 |
| 554 | 436 | 118 | 3.69:1 |
| 521 | 398 | 123 | 3.24:1 |
| 760 | 562 | 198 | 2.84:1 |
| 426 | 316 | 110 | 2.87:1 |
| 544 | 398 | 146 | 2.73:1 |
| 676 | 501 | 175 | 2.86:1 |
Now consider the variation around the 3 : 1 ratio. Why is there a variation in the ratio of purple to white grains, i.e. why is this ratio not exactly the expected ratio of 3 :1? The short answer is 'chance'. The predicted or expected ratio does not tell us the actual ratio of purple to white grains in a particular cob, but rather the most probable ratio, as explained in Box 2, More about chance and probability in genetics.
Box 2 More about chance and probability in genetics
The observed deviations in genetics experiments from predicted ratios like 3 :1 are similar, in principle, to what you observe when you toss a coin. The expected ratio of heads to tails is 1 : 1 because each is equally likely. If you were to toss a coin a million times, the result would be a ratio very close to 1 : 1. If you tossed it only ten times, however, the result might be quite a marked deviation from a 1 : 1 ratio (e.g. six heads and four tails — a ratio of 3 :2, or 1.5 : 1 — instead of five heads and five tails).
In an experiment with maize, suppose that exactly half of the ovules on a female flower head contained the allele G and the other half contained g. Imagine also that of the millions of pollen grains that are artificially dabbed onto the female flowers in a breeding experiment, exactly half contain G and the other half contain g. Which of the millions of pollen grains produces the few hundred gametes that win the race to fertilise the ovules is totally independent of whether the gametes contain G or g. Purely by chance, the proportion of G-bearing gametes that succeed in this way may be rather higher than one-half for one flower head. The cob would then develop rather more than the 3 : 1 ratio of purple to white grains. On another flower head the opposite might occur, with a disproportionately higher number of g-bearing pollen grains fertilising the ovules. Similarly, the proportion of g-bearing ovules fertilised may be more (or less) than one-half. If a sufficiently large number of flower heads are investigated, giving a very large total of the number of grains counted, then the ratio will be very close to 3 : 1, but for any one flower head it may deviate quite markedly from 3:1.
Adding all the purple grains and all the white grains of the cobs given in Table 2, gives an overall ratio close to the expected ratio of 3 : 1, in fact a ratio of 3.03 : 1.
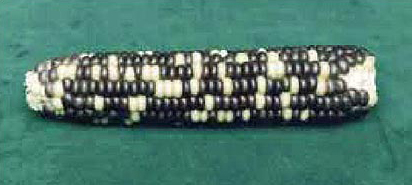
Returning to our examination of the expected phenotypic ratio of 3 : 1, a cob of the F2 generation is shown in Figure 8.13. You can see how the purple and yellow grains (the latter are white when fresh) are distributed at random throughout the cob. This distribution reflects the chance events of which allele, G or g, each ovule bears and whether it was fertilised by a G-bearing or a g-bearing pollen grain.
Click on 'view document' and print the page required for the activity.
View document [Tip: hold Ctrl and click a link to open it in a new tab. (Hide tip)]
Activity 10 The 3:1 phenotypic ratio
This activity involves you in calculating the ratio of the two phenotypes in the cob in Figure 13, and thinking about what this tells you.
This activity is designed to consolidate your understanding of ratios, fractions and probability. It takes the form of a series of very short questions. Try to answer all of the questions before revealing the answers given beow. The comments also contain some general advice on ratios and fractions.
a. Count the purple and the white grains (yellow in this dried cob) on the one visible side of the F2 cob in Figure 13. Calculate the ratio of purple to white grains, expressing your answer in the way shown in the right-hand column of Table 2.
b. Write your results down if you don't think that you will be able to remember them. How do your results compare with our results given in Table 2?
c. The grains on the cob are the result of fertilizations between two kinds of pollen grains, G-bearing and g-bearing, and two kinds of ovules, G-bearing and g-bearing. Thus the expected phenotypic ratio is three dominant (purple) : one recessive (white). Explain the deviation from the 3 : 1 ratio for the part cob that you counted.
d. Now think again about the grains you counted. How many grains are visible altogether? Give the number of white grains as a fraction of the total number of visible grains.
e. What is the probability that an F2 maize grain will have the genotype g g? Compare this with your answer to part (d).
Answer
a. There are 134 purple and 42 white grains visible (your may have counted slightly different numbers depending on whether or not you included part grains that are visible). This gives a ratio of 134 : 42, which simplifies to 3.19 : 1.
b. The numbers of purple and white grains that you counted will be much smaller than the values in Table 2, since you counted grains on only part of a cob. However, for each cob in Table 2 the ratio of purple to white grains, to the nearest whole number, is 3 : 1, although all the cobs show a slight deviation from this. Your ratio will show a deviation from 3 : 1, but the deviation is likely to be within the range covered by the ratios in Table 2.
c. The deviation from a 3 : 1 ratio is due to chance events. Possibly the number of G-bearing ovules on the cob was not equal to the number of g-bearing ovules and/or possibly the numbers of G-bearing pollen and g-bearing pollen that succeeded in fertilizing the ovules were not equal. The total number of grains counted was relatively small, hence the chance of a deviation from the expected ratio is high.
d. There are 134 purple and 42 white grains visible, giving a total of 176.
Thus the number of white grains as a fraction of the total number is 42/176 which is 1/4.19 i.e. approximately ¼.
e. There are four possible outcomes for a cross between two maize plants that are heterozygous for grain colour. Two of these outcomes give the Gg genotype, one gives GG and one gives gg, so the probability that an F2 maize grain has the genotype gg is ¼.
The value that we calculated in (d) is in good agreement with the expected value of c, although it is not exactly the same because of chance variation.
Activity 11
Table 3 gives the numbers of the two contrasting phenotypes in the F2 generation for two of Mendel's pea-breeding experiments. In the seed colour experiment he counted the largest number of F2 progeny and in the pod colour experiment he counted the smallest number of F2 progeny. In both cases, the phenotype printed in italics is the dominant one.
-
Calculate the actual F2 phenotypic ratios in these two experiments.
-
Comment on the ratios that you have calculated.
Answer
(a) The F2 phenotypic ratio for seed colour is 3.01 : 1 (yellow : green) and that for pod colour is 2.82 : 1 (green : yellow).
(b) The deviations from a 3 : 1 ratio are due to chance. However, we do expect larger variations with smaller samples. This is what we observe in Mendel's results. In the experiment in which Mendel counted a large number of seeds, he obtained a ratio very close to 3 : 1. In the experiment in which he counted a much smaller sample of pods, he obtained a ratio that showed a greater deviation from a 3 : 1 ratio. {You may also have observed that in the phenotype for seed colour, yellow is dominant to green, but in the phenotype for pod colour, green is dominant to yellow! So one should not make assumptions about which phenotype is dominant and which is recessive.}
| Character | Numbers of each phenotype | Ratio of phenotypes |
|---|---|---|
| seed colour (yellow or green) | 6 022 yellow | 2 001 green |
| pod colour (green or yellow) | 428 green | 152 yellow |