
 In response to a listener question, Adam Rutherford asks various scientists - what is a 'model' in science? Andrew Ponson introduces us to the concept, Carole Haswell discusses how they work in astronomy, Paul Donald explains their use in conservation science and hydrologist Nick Reynard talks about using models to simulate extreme weather events such as flooding.
Question from Jim Hay: "I wonder if you could explain what a model is? The term is used so frequently on science programmes that I just let it slide past me but the fact is I don’t know what it means exactly when a scientist says that they made a model."
Listen to the audio interviews
ADAM RUTHERFORD: At the most basic level, a model is a way of taking data and measurements from the real world and simulating what happens when we fiddle around with them: how much rainfall, the flow of rivers, that type of thing. It’s a way of simplifying the chaos of the physical world, in a computer so that we can try to predict what might happen in the real world. You can run simulations thousands of times, each with very subtle changes to see what happens.
ANDREW PONSON, Astrophysicist: I would say a model is a set of ideas we have around how some specific aspect of nature works. And normally when we call it a model, we probably mean it’s tentative at some level. So we’re not trying to make a claim that we’ve summarised everything about how that particular thing works. We’re trying to give some impression that we haven’t yet packaged up everything about that particular aspect of nature, but we have some working set of ideas that we’re using to create tests that we can then go and compare to reality.
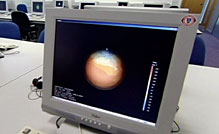 CAROLE HASWELL, Astrophysicist: ...One of my colleagues wrote [that] the essence of being a physicist is knowing which approximations to make. And so whenever we’re seeking to understand something, you need to tease out what are the important things that are influencing this. [...] It’s this sort of stripped down mathematical description of the essence of things that you can then embody a computer code with. So you can put the system of simple equations or perhaps quite complex equations into a computer programme and you can then set the programme to go to watch the interplay of the various factors that you’ve teased out as being important. So, for example, if you were trying to understand how the planets in the solar system move, then you would need to put in a mathematical description of gravity, and then you could set your solar system going and watch things moving. [...] It’s a way of using what you’ve observed to work out what you think is the most important things that are governing the behaviour. And then setting up something that encapsulates what you think is important, to see if that actually reproduces what you’re observing.
 PAUL DONALD, RSPB conservation scientist: To me a model is a formula that helps me to explain variation in something I’m interested in. So let me give you an example. Let’s say that I’m interested in a particular species of bird, let’s say skylarks, for example, and I go out and I collect data on the numbers of skylarks in, let’s say, a hundred fields across Southern England. And what I would certainly find is that the number of skylarks varies between different fields. Some fields will have very few birds, maybe none at all; other fields may have lots of birds. So I’m interested to know why some fields have more skylarks in them than others, and I would use a model to look at that.
So while I was out collecting my counts of skylarks, is I would also measure a whole load of other things that I think might possibly explain the variation in skylark numbers. What the model would do is it would allow me to identify which of those predict skylark numbers and which ones don’t. [...] The real skill, in a way, with these things is in the interpretation. So what this model shows is that for the variables that I’ve put into it, some of them significantly predict skylark numbers and others don’t, but it can’t predict things I haven’t put in. [...] So the model is essentially wrong because I haven’t measured the thing that’s the most important driver of skylark population numbers. It may still be that the things I’ve measured are partially determining skylark numbers, but the real underlying thing I may not have measured at all. So there’s a kind of standard thing in ecology that says all models are wrong, but some of them are useful.
This is the only method really so, if I was only interested in one thing, the relationship between skylark numbers and field size, for example, I could simply plot them out and see, if as field size gets bigger, skylark numbers increase. But you can only do that for one thing at a time. I can’t look at all these different variables at the same time, and that’s what the model allows me to do. And it’s an absolutely fundamental tool in ecology and conservation is this kind of way of analysing data.
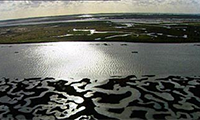 NICK REYNARD, Hydrologist, extreme weather: Ideally we’d have data absolutely everywhere, so we’d understand what was going on in the river system and with the rainfall all the time everywhere. We can’t have that, it’s not practical and it’s too expensive, so we have to be able to fill the gaps. And we use models to do that. So we fill the gaps in space and in time by working out how the rainfall moves through the landscape into the rivers and then ultimately out into the seas, and the models are just computer simulations of how that water moves so that we can actually understand where high and low flows occur anywhere across the county or even across Europe or across the globe. So that’s what we use models for, and that helps us understand right now what the hydrology is doing, what the flows are like, but it also allows us to use those models to forecast and predict what the flows might be like in the future.
Try these next
-
Meteoric
Take part now to access more details of MeteoricRocks hurtling through space shape the surface of the moons and planets as collide – and now you can use your skill and knowledge to make your own mark. Can you cover a target percentage of a planet or a moon’s surface with impact craters – by choosing meteroids based on size, make-up and speed and aiming them at your chosen target.

Level: 1 Introductory
-
Wild Weather Kitchen Experiments: Floods
Watch now to access more details of Wild Weather Kitchen Experiments: FloodsCreate your own mini flood model and unleash the devastation wreaked by lots of rain by following the steps in this video.

Level: 1 Introductory
-
Basic science: understanding experiments
Learn more to access more details of Basic science: understanding experimentsThis free course, Basic science: understanding experiments, introduces you to science-based skills through simple and exciting physics, chemistry and biology experiments.

Level: 1 Introductory
-
Try science courses for free
Learn more to access more details of Try science courses for freeWe have free units covering a range of science subjects for you to try

This is an extended feature from BBC Inside Science originally broadcast on 10th December 2015.
Click to find out more about Inside Science on OpenLearn.
Rate and Review
Rate this audio
Review this audio
Log into OpenLearn to leave reviews and join in the conversation.
Audio reviews