

3.2 Serial and parallel search
Examine the three sections of Figure 5 and in each case try to get a feel for how long it takes you to find the ‘odd one out’. The figure is a monochrome version of the usual form of these stimuli you can see a coloured example in colour Plate 3.
Click to view Plate 3: Typical stimuli used in Triesman’s experiments. [Tip: hold Ctrl and click a link to open it in a new tab. (Hide tip)]
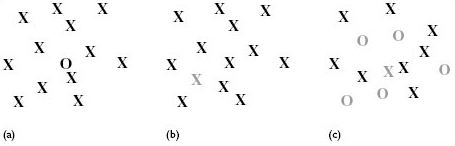
You probably felt that the odd items in Figures 5(a) and 5(b) simply ‘popped out’, and were immediately obvious, whereas the red X in Figure 5c took you slightly longer to find. These kinds of effect have been explored formally by Treisman (e.g. Treisman and Gelade, 1980). The odd item is referred to as the target and the others as the distractors. Treisman showed her participants a series of displays of this nature, and measured how long it took them to decide whether or not a display contained a target. She was particularly interested in the effect of varying the number of distractors surrounding the targets. It was found that for displays similar to Figures 5(a) and 5(b) it made no difference to decision times whether there were few or many distractors. In contrast, with the 5(c) type of display, participants took longer to decide when there were more distractor items; each additional distractor added approximately 60 ms to the decision time.
How is that pattern of results to be explained? Treisman pointed out that the first two displays have target items which differ from the rest on only one dimension; the target is either a round letter (O), among ‘crossed-line’ letters (X), or a red letter among black letters. The Figure 5(c) display type is different; to identify the target it is necessary to consider two dimensions. It has to be an X (but there are others, so on its own being an X does not define the target), and it has to be red (but again, there are other red letters). Only when X and red are combined does it become clear that this is an ‘odd one out’. All these features (various colours and shapes) are quite simple and are derived in the early stages of visual processing, but importantly different types of analysis (e.g. of shape or colour) take place in different parts of the brain. To see whether there is just ‘redness’, or just ‘roundness’ in a display is easy, so easy in fact that the whole display seems to be taken in at a glance, no matter how many items there are. In other words, all the different items are processed at the same time, in parallel. The situation is very different when shape and colour have to be combined because they are determined in different brain areas; somehow the two types of information have to be brought together. You will recall from Section 2 that attention appears necessary to unite episodic and semantic information. Treisman proposed that it is also required to link simple features. Each item in the display has to receive attention just long enough for its two features (shape and colour) to be combined, and this has to be done one item at a time until the target is found. In other words, the processing is serial, so takes longer when there are more items to process. It has been known for some time that the parietal region of the brain (part of the cortex that sits like a saddle across the top of the brain) is one of the areas involved in attention. A fuller account of the problems that result from damage to this area will be given in Section 5.2; at this point it is relevant to mention that Treisman (1998) reports investigations with a patient who had suffered strokes in that region. He was shown simple displays, containing just two letters from a set of three (T, X and O); they were printed in different colours, from a choice of three (red, blue or yellow). He was asked to describe the first letter he noticed in the display. On a particular occasion he might be shown a blue T and a red O. Although he often made mistakes, he would rarely respond ‘Yellow X’ to that display; that is, he did not claim to see features that were not there at all, so he was not simply guessing. What he did say quite often would be something like ‘Blue O’. He had correctly identified features that were present, but was unable to join them appropriately. The implication of this is that both the detection and the integration of features are necessary steps in normal perception, and that integration requires attention.