2.1 Trends and causes of population growth
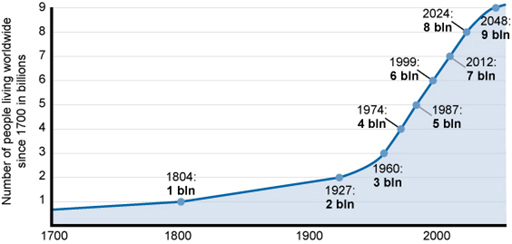
Throughout human history the world’s population has been gradually growing. Figure 2.1 shows the trend from the year 1700. Growth is slow until the middle of the 20th century, when the gradient (slope) of the graph increases, indicating a change to more rapid population growth. The graph continues into the future to a predicted global population in 2050 in excess of 9 billion.
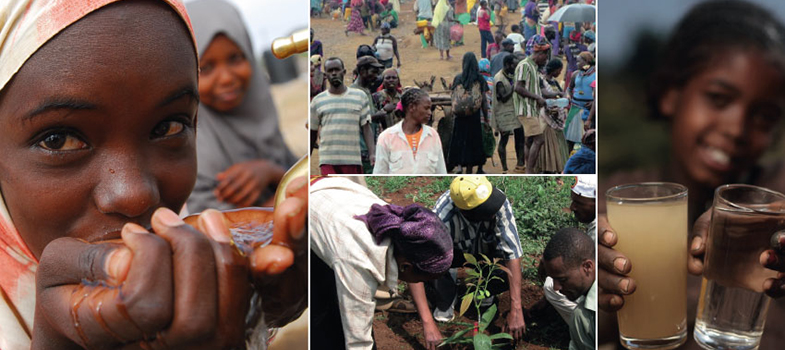
There are many factors that influence this trend. High rates of infant and childhood deaths and short lifespans put a limit on population growth in the past. However, improvements in nutrition, water, medical care and other technological advances have contributed to a sharp decline in deaths while births continue to increase, resulting in population growth.
Population change is governed by the balance between birth rates and death rates.
- If the birth rate stays the same and the death rate decreases, then population numbers will grow.
- If the birth rate increases and the death rate stays the same, then population will also grow.
Look at Figure 2.1. How would you describe the predicted trend in world population for the middle of the 21st century?
For most of the 21st century, from 2000 to about 2040, the trend shows a steady increase. By the middle of the century, at the far-right side of the graph, the gradient of the line on the graph is less steep – it flattens out slightly – indicating the rate of increase is expected to slow down by that date.
The main causes of death are disease, famines, accidents and war. Underlying these direct causes are interrelated contributory factors such as poverty, availability of health care, education and other social and economic factors. Since the start of the 20th century, there has been a sharp decline in death rates and an increase in length of life due to changes in these factors, which has resulted in an ageing global population. In 1950, about 8% of the world’s population was above 60 years of age. In 2013, this proportion had increased to 12% and it is expected to reach 21% in 2050 (UNDESA, 2013).
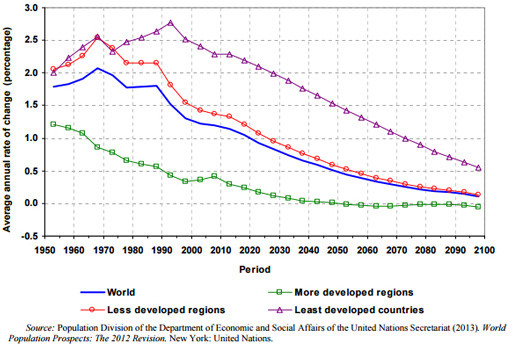
The rates of change in population vary in different regions of the world and can be categorised into groups based on the socio-economic development status of different countries, as shown in Figure 2.2.
Does the trend in population change shown in Figure 2.2 correspond to the answer to the previous question about Figure 2.1 and the predicted trend for the middle of the 21st century?
Yes. Figure 2.2 shows a downward trend in the annual rate of change in all regions of the world for the remainder of this century. This corresponds to the slowing down of population increase shown in Figure 2.1.
- a.From Figure 2.2, which group is expected to have zero population growth by 2050?
- b.Which development group has the highest annual rate of population change?
- a.More developed regions are expected to have zero growth or, in other words, a static population level.
- b.Least developed countries contribute the highest annual population change for the world in the years between 1950 and 2100.
The least developed countries continue to have a higher rate of population increase for several reasons. Significant among these is the fact that the benefits from advances in health and agriculture are not spread evenly across the world. Medical technologies, for example vaccines and antibiotics, reduce the death rate by protecting people against diseases like influenza, measles, polio and rubella. However, vaccines are still not available for many diseases like malaria that are common in less developed countries, particularly in sub-Saharan Africa. Other public health measures, like water and sanitation, waste management and nutritional education are very important in preventing disease and in reducing the death rate. These measures are well developed in industrialised countries but less so in developing countries. Similarly, in agricultural science and technology, advances such as new kinds of seed, fertilisers, pesticides and mechanisation in farming have transformed food production. These have increased the quantity of food produced, which has helped to improve nutrition and decrease death rates. However, advanced food production and distribution are still developing in many countries.
Learning Outcomes for Study Session 2