2.2 Demographic transition
The changes in the population of countries over time have been found to follow a pattern described as ‘demographic transition’. Demographic transition is a process of fundamental change by which a country moves gradually from high birth and death rates to low birth and death rates. During the transition, death rates decline first and this is followed by a decline in birth rates. Figure 2.3 shows the five stages of demographic transition, described below.
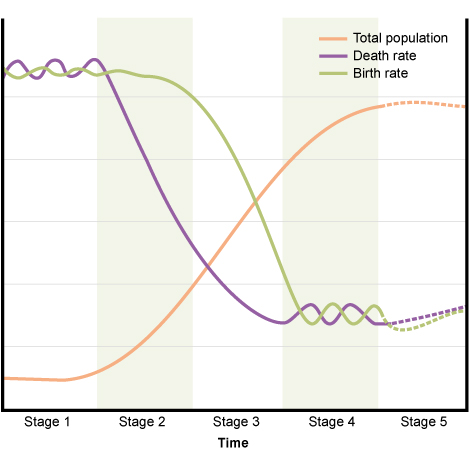
The stages are:
- Stage 1: High birth rates and death rates: This stage is characterised by high birth rates, high death rates and little population growth. Total population numbers are low and the high birth rate is balanced by the high death rate.
- Stage 2: Continued high birth rates, declining death rates: In this stage, there is a decline in the death rate. As the birth rate is still high, the result is population growth as there are more births than deaths.
- Stage 3: Falling birth rates and death rates, finally stabilising: Both birth rates and death rates are declining, but birth rates remain higher. Population growth continues due to the large numbers of people in the reproductive age group. Reproductive age group refers to all women aged 15-49 years. Death rates gradually level off and birth rates decline until eventually the population growth slows down.
- Stage 4: Death rates and population growth slows: The fourth stage is characterised by a fall in birth rate and a decline in the proportion of the population in the reproductive age group. These changes cause population growth to end and population size stabilises. The total population number is high, but the low birth rate and low death rate balance each other so that the population is no longer increasing. In this phase the birth rate falls to below replacement level. The replacement level is the number of births to each generation required to replace the generation before. You might think the replacement level would be two children per woman to replace the two parents, but in practice the level is slightly higher than this. The figure depends on several factors including fertility and mortality, and varies in different regions and countries. In developed regions it is usually taken to be about 2.1 children per woman but this figure is generally higher in less developed regions.
- Stage 5: Negative population growth: This stage occurs when slow population growth turns into a population decline after birth rates fall below the replacement level and, on average, women have fewer than two children in their lifetime. At this stage, the total population is high but it is going into decline due to an ageing population.
Countries throughout the world are currently at different stages of demographic transition. Some countries in Asia and Europe have low death rates, low birth rates and low population growth and are in stage 4. Most of the ‘least developed countries’ are still in stages 2 and 3. There are many causes that contribute to the changes of the demographic transition model and account for the variations seen between different countries. The main factors include:
- improved health and living conditions over time
- increase in age at time of marriage
- decrease in need or wish to have more children
- move from rural to urban living (urbanisation)
- increase in level of education, especially of girls and women
- increase in paid employment opportunities for women
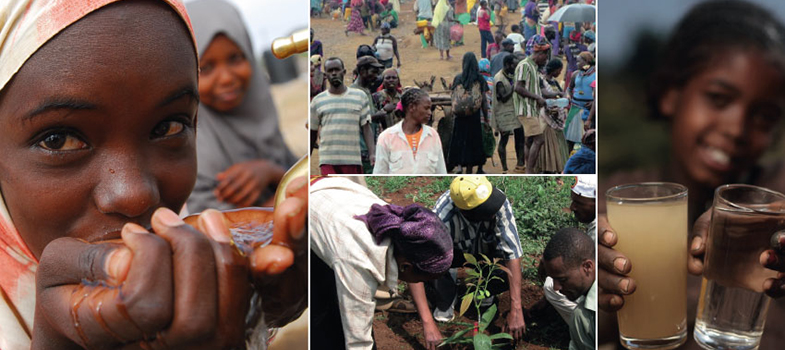
- increase in awareness and availability of contraception and family planning services (Figure 2.4).

How does an increase in marriage age and better awareness of family planning services affect population growth?
These would both lead to a decrease in the birth rate, which leads to a decrease in population growth.
Ethiopia is currently at stage 2 or 3 of the demographic transition. Looking at Figure 2.3 and the description of these stages in the text, what do you think this means for Ethiopia’s birth and death rates and for population growth in Ethiopia?
Both the birth rates and death rates are declining, but the birth rate remains much higher than the death rate, therefore the population continues to increase.
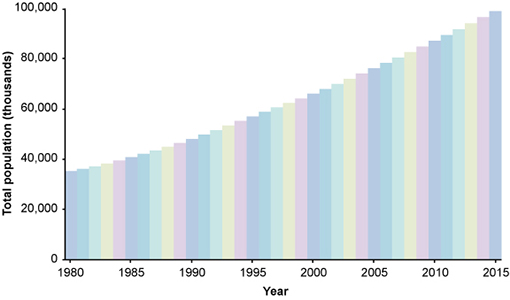
Figure 2.5 shows how Ethiopia’s total population has changed since 1980 and is heading towards 100 million.
2.1 Trends and causes of population growth