
9.2.1 Global land and sea surface temperatures are rising
In the 100 years between 1905 and 2005, the average global surface temperature has increased by 0.74 °C. Most of this increase has occurred since 1950 and the upward trend is continuing (Bates et al., 2008). The first decade of the 21st century was the warmest since humans began recording surface temperature (IPCC, 2013). If present trends continue, the average global surface temperature is projected to increase by between 0.3 °C and 4.8 °C by the end of the 21st century (IPCC, 2013).
The surface temperature of the oceans has also been rising and the increase is expected to accelerate during the 21st century. Figure 9.1 shows global averages for the annual combined land and ocean surface temperature and the average in each decade from 1850 to 2012.
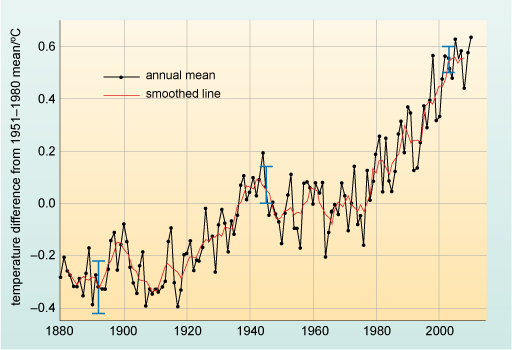
Look at the general pattern of surface temperatures shown in Figure 9.1. How would you describe the trend during this period?
The global surface temperature fluctuated around a relatively stable average from 1880 to about 1920, but after that date it began to rise. Around 1950, the temperature increase seems to have levelled for about 30 years, but it has been increasing rapidly in the decades since 1970.
9.2 Observed and projected patterns of global climate change