
Size and income of the voluntary sector
The National Council for Voluntary Organisations (NCVO), as the largest umbrella body for the voluntary sector in England, annually publishes research on the sector in the UK Civil Society Almanac (the Almanac). The Almanac is produced by bringing together data from registered charities’ accounts, administrative data and surveys such as the Labour Force survey.
The largest body for the voluntary sector in Wales is The Wales Council for Voluntary Action (WCVA [Tip: hold Ctrl and click a link to open it in a new tab. (Hide tip)] ).
In Northern Ireland you have the Northern Ireland Council for Voluntary Action (NICVA), while the Scottish Council for Voluntary Organisations (SCVO) is the largest voluntary sector body in Scotland.
This short animation takes you through the key facts and figures on the voluntary sector from the Almanac 2018. Some of the figures will then be explained in more detail in the rest of this topic.
One way to consider the size of the voluntary sector is to look at the number of registered organisations. Because many voluntary organisations are not registered – either they are too small to register or they prefer to be a company or other structure where we cannot distinguish their social purpose – the Almanac reports the number of organisations as those that are currently registered as general charities (those registered charities that meet the criteria of formality, independence, non-profit distributing, self-governance, voluntarism and public benefit). This is:
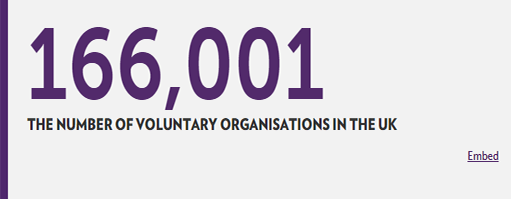
However, if we consider the wider ‘civil society’ definition of people working together to make a difference to their lives or the lives of others, then it is estimated that there are around 900,000 groups working in this way. These blurring boundaries and definitions make it tricky to conduct research on the full voluntary sector. Therefore, this group of 166,001 registered charities is used for all of the Almanac analysis but we must bear in mind that the full sector is much larger.
Another way to consider the size of the voluntary sector is by its income and expenditure. Figure 5 below from the Almanac gives the overall picture of the money into and out of the voluntary sector in 2015/16.
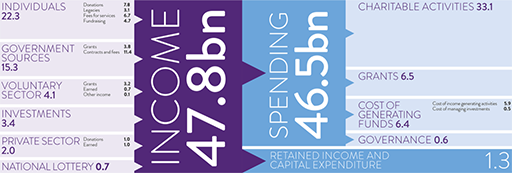
From this figure we can see that in 2015/16 the voluntary sector got £47.8 billion pounds, a rise on the previous year, driven by the increase in income from individuals. Donations or purchase of products and services by individuals is the largest source of money for the sector. This is followed by government sources, although cuts to total government spending in recent years have followed through to the voluntary sector, which has seen a downward trend in government funding since a 2008/09 peak. Levels of government grants to the sector – £2.8bn – are less than half the level they were ten years ago.
In terms of spending, the diagram shows that 85% of the sector’s income in 2013/14 went directly to achieving its charitable aims. In order to maximise the amount of money available for their charitable activities, charities also need to spend money in order to generate further funds. Voluntary organisations spent £5.4bn on generating funds in 2013/14 and for every £1 spent, £4.20 was generated in return. More than nine in ten charities also hold some form of assets – such as buildings, cash, investments – which they use to contribute towards their charitable activities or to help generate funds.
Money is not evenly distributed around the sector, which is very diverse. When a lot of people think of charities or the voluntary sector, they think of the large organisations like Oxfam or Cancer Research UK. Although these large organisations have a big proportion of the sector’s income, they are actually very few in number. In reality, there are considerably more small organisations in the voluntary sector than large ones.
Activity 2
Study the graph below that groups voluntary organisations by size (from micro to super major, as defined underneath) and shows how many organisations are in each group, along with their income, spending and assets. In particular, look at the first and second bars and try to extract the following pieces of information.
What percentage of voluntary organisations have an income of less than £100,000 per year, so are ‘micro’ or ‘small’?
What percentage of the sector’s income do the 3% of charities that qualify as ‘large’, ‘major’ or ‘super major’ receive?
Which size of organisation receives a total income that is roughly in proportion with the number of organisations in that category?
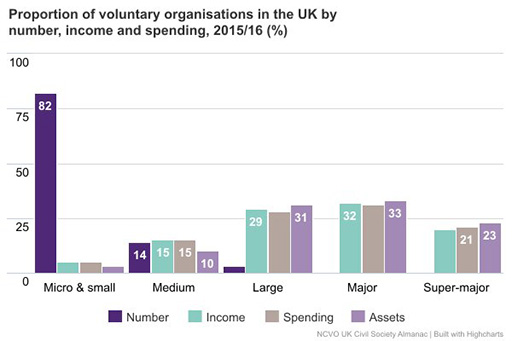
‘Micro’ is defined as less than £10,000 income per year
‘Small’ covers £10,000–£100,000 income per year
‘Medium’ is £100,000–£1million income per year
‘Large’ is £1million–£10million income per year
‘Major’ is £10million–£100 million income per year
‘Super major’ is over £100 million income per year.
Discussion
83% of all voluntary organisations have an annual income of less than £100,000, so are defined as ‘micro’ or ‘small’ organisations. These are likely to be local or specialist groups without any paid staff – sports or activity clubs, parent groups, rare illness support networks, for example. Even though they make up so much of the sector in number, they account for less than 5% of the total income.
Voluntary organisations with an annual income of £1m or more account for 80% of the sector’s total income, yet make up only 3% of the total number of charities. Most of the UK’s largest charities, by income, are organisations that work nationally or internationally. They are predominantly charities that focus on health (including health research), children, disability or international relief. Cancer Research UK is the UK’s largest charity.
Medium-sized organisations are the only group to hold a percentage of the income (14%) that closely reflects the percentage of organisations within the sector (around 15%). Organisations in this category have an income of between £100,000 and £1m per year and are likely to include a local women’s aid charity or a national performing arts charity, for example.
1.2 Size, scope and role of the voluntary sector