
11.1.1 Water use
Water use by organisations is a huge subject area, but the focus here is just as an input into organisations.
The total volume of water on Earth is estimated to be about 1.4 billion km3, of which about 2.5% is freshwater (35 million km3). Nearly all of this freshwater is in the form of ice/snow or ground water, leaving very little (less than 1%) readily available to ecosystems in lakes, rivers and other surface water bodies (UNEP, 2012a).
Human freshwater use has been growing significantly, increasing at twice the rate of population increase in the twentieth century. For example, in 60% of European cities with more than 100 000 people, groundwater is being used at a faster rate than it can be replenished (UNEP, 2012b).
Of the freshwater used by humans, about 70% is used for irrigation, about 22% for industry and about 8% for domestic use. Working on the basis that irrigation is often done by small family-type organisations, we can estimate that anything between 50 and 90% of freshwater used is used by organisations of some sort (UNEP, 2012b).
You can see some of this information more easily in Figure 13.

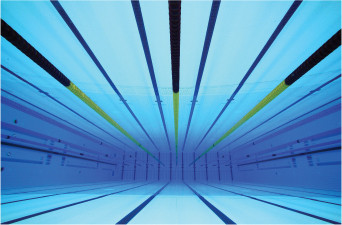
Collectively, UK water companies supply 17 billion litres per day of drinking water and handle 16 billion litres of wastewater per day (WaterUK, 2012). This is equivalent to approximately 8500 Olympic-sized swimming pools (where 1 billion litres = 500 Olympic swimming pools).
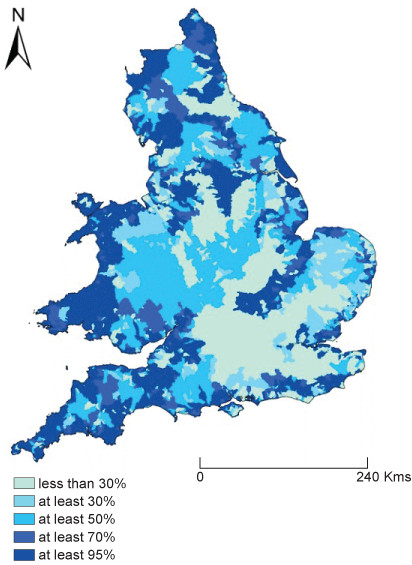
Drawing resources from the environment on this scale can have impacts on river systems, groundwater and species, depending on where and the type of habitats the water comes from. In recent decades, many habitats and species in the south east of England in particular have come under pressure in terms of surface and groundwater availability, as shown in Figure 15.
A similar picture is emerging elsewhere in Europe and globally. Figure 16 shows water stress in Europe in 2005 and projected forward to 2050 under an ‘economy first’ scenario. The stresses equate to centres of population shown in the map on the right.
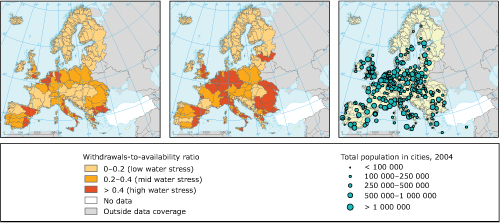
These water stress maps reveal the pressures on resources, but do not show the additional impacts arising from the energy and resources used to abstract, store, purify and supply the potable water, and then deal with the resulting waste water.
These figures and maps are high level. But the dependency of organisations and business on sustainable environmental inputs are receiving increased scrutiny, with at least one recent survey suggesting that water security (e.g. drought and flooding) was a major concern, impacting on business operations for an increasing number of the largest 500 global companies (Brown, 2012). At the level of an individual organisation this can be significant. A car manufacturer, for example, uses a significant volume of water, with estimates of 50 to 80 m3 (50 000 to 80 000 litres) of water required per car in manufacturing (Berger et al., 2012), although this estimate could easily be doubled or trebled depending on manufacturing processes and efficiencies.