

Donahue, S. W. et al. (2003) Serum markers of bone…, Clinical Orthopaedics and Related Research, 406. Copyright © Dr S. W. Donahue
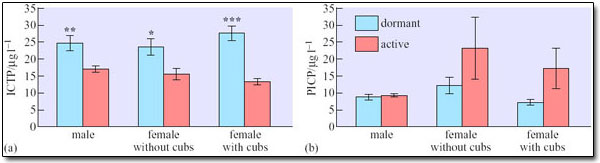
Figure 13 The quantities of (a) ICTP and (b) PICP measured in blood samples taken from various black bears. The asterisks indicate where the differences between dormancy and activity for the same animals are statistically significant: * significant at P < 0.05, ** significant at P < 0.01, *** significant at P < 0.001.