11 Understanding shares
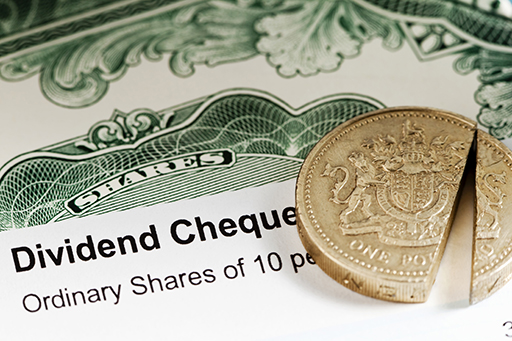
Shares are also called ‘equities’. They entitle the holder to a share or part ownership in a company. Depending on the type of share, this may entitle the shareholder to vote on how the company is run. Shares also usually entitle their owners to receive dividends that may be paid by the company out of the profit it makes. The receipt of these dividends is, for the shareholder, the income element of the return from their investment in the shares.
| High (p) | Low (p) | Company | Price (p) | +/− (p) | Yield (%) | P/E |
|---|---|---|---|---|---|---|
| 234 | 130 | JD Sports | 130 | −3 | 0.2 | 15.7 |
| 257 | 132 | Marks & Spencer | 137 | −5 | - - | - - |
| 8426 | 5770 | Next | 5892 | −44 | - - | 12.9 |
| 340 | 235 | Sainsbury J. | 239 | −1 | 4.4 | 20.0 |
| 303 | 220 | Tesco | 274 | +3 | 3.6 | 20.8 |
Notes:
- No yield is provided for companies that have not paid a dividend for their previous financial year.
- No P/E can be provided for companies that reported a loss in their previous financial year.
Look at the table above showing some UK companies’ share prices. Take time to familiarise yourself with the key terms that are used when analysing the performance of a company’s shares.
Here’s an explanation of the information presented in the columns of the table.
- High: the highest price of share in a certain time period, for example over the last year.
- Low: the lowest price of share in a certain time period, for example over the last year.
- Company: the name of the company whose shares are shown in the table.
- Price: the current price of share, shown in pence (this is usually the price at the end of the previous working day).
- +/-: the change in the quoted share price from the previous day.
- Yield: the dividend income per share after tax expressed as a percentage of the price of the share. High figures can suggest higher income from investments, but a high yield can also indicate that the company is not growing very fast or is quite risky.
- P/E: the ‘price/earnings ratio’ is the share price divided by the earnings per share. So, if the share price is 200 pence and the earnings per share are 5 pence the P/E ratio would be 40 (note that earnings are the company’s profits after tax, i.e. net profits). Investors are prepared to pay more for shares whose earnings they think are going to rise strongly, so demand pushes up the share price, which in turn increases the P/E ratio. The P/E ratio is often seen as a barometer of confidence in a company’s prospects.
Share prices can be seen in most newspapers which may include some of the additional details set out above.
The price at which a particular share can be bought or sold will vary from minute to minute depending on the balance of investors who want to buy them and existing holders who want to sell. If investors are able to sell shares at a higher price than they originally paid, they make a capital gain. If they sell for less, they make a capital loss.
Shares are bought through a stockbroker. A stockbroker can be a specialist company or an arm of a high street bank. You can find one via a number of methods, be that word-of-mouth, through the internet, or through the Personal Investment Management and Financial Advice Association (PIMFA) [Tip: hold Ctrl and click a link to open it in a new tab. (Hide tip)] .
Activity 6 Understanding information about shares
Have a look at the data in the table above. Without researching further, what do you think the information is telling us about how the companies are performing?
Answer
The most telling information is where the current share price is in relation to the high and low points in the past year. Those with a share price close to the year’s high can be viewed by investors as doing better than those whose share prices are close to the year’s low. Note, though, that if all (or most) share prices are near their low for the year, then this almost certainly reflects that the equity market as a whole is experiencing a period of weakness. The information from the yield and P/E data is more complex to interpret – for example, a high yield may result from a company paying a high dividend to keep investors happy at a time of difficulties for the business.

