

1.2.2 The UK’s savings ratio
Another type of data to look at, apart from that of savings, is data about saving. This is usually done by examining what is called the household savings ratio (the percentage of annual household disposable income that is saved rather than spent).
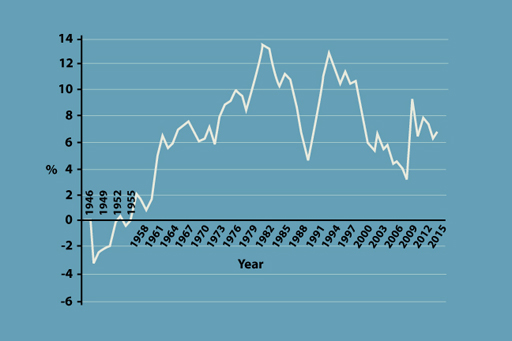
Figure 6 shows the household savings ratio for the UK has ranged from less than zero (in other words, borrowing rather than saving) in the late 1940s and early 1950s to a peak of 12.3% in 1980. The savings ratio then dipped to a low of 3.9% in 1988, rising to another peak of 10.8% in 1992. By early 2008 (during the financial crisis), the ratio had slumped to 2% but recovered sharply the following year to reach 6.3%. This shows how the household savings ratio tends to be quite cyclical.
How can we explain these changes? One factor has been the state of the UK economy. When the economy has been growing quickly (and so, personal incomes have been rising), the household savings ratio has been lower. This can be explained by the fact that when things are going well, confidence is high and people tend to spend more. This was the picture in the late 1980s and in the early 2000s. When the economy has experienced very low growth or even recession, such as in the early 1980s, 1989–1992 and again following the financial crisis, and incomes have not risen as fast or have been falling, the household savings ratio was higher. This is because when people are more concerned about their future, they tend to cut back on spending and save more.
Other factors also help to explain the changes in the UK household savings ratio. When inflation was high in the mid and late 1970s, for example, households needed to save more to stop the real value of their savings falling – consequently the household savings ratio increased. The household savings ratio averaged 8.5% during the period of relatively higher inflation between 1969 and 1991 (inflation averaged 10%), but it averaged 4.3% during the periods of relatively low inflation in the 1960s, and 4.3% since 1998 when inflation has again been low.