

1.2.3 How the housing market affects savings activity
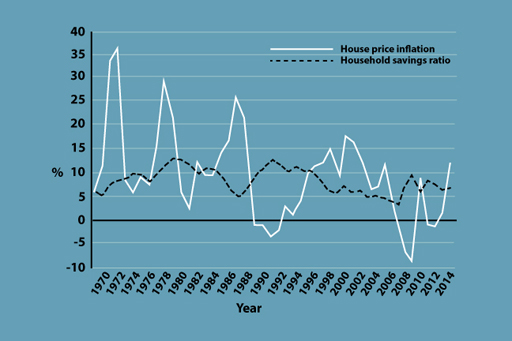
When examining investment behaviour, data suggests the state of the housing market may also be important. Figure 7 shows changes in the household savings ratio and changes in house prices in the UK between 1970 and 2014.
Activity _unit1.2.2 Acitivity 1.3 House prices and saving
Note your answwers to the following questions:
- Look at the chart and consider any pattern between house prices and the household savings ratio.
- Can you think of any reasons to explain this pattern?
Discussion
There appears to be an inverse relationship between house prices and the household savings ratio. That is, when house price increases were higher (for example, in the late 1980s and most of the 2000s), the household savings ratio was lower, and when house prices were lower (for instance, in the early 1990s and 2009), the household savings ratio was higher.
This may be because people often feel that they do not have to save as much when their wealth is increasing due to the increased value of their house. Conversely, in 2009 there was an increase in saving as house prices fell and households repaid some of their borrowings. The slight dip in the savings ratio since 2009 may be linked to the pickup in house prices after 2012.