

3.2 How to deal with risks that are on a continuum
As discussed earlier, a number of risks operate on a continuum. These risks exist as a range of impacts that can simplistically be described as there being a much higher probability of a low impact and (hopefully) a much lower probability of a very large impact. One approach, already highlighted, is to ensure that the organisation adopts a ‘single version of the truth’ where everyone is expected to report one scenario; however, with more complex risks, where there are many root causes, this may not be appropriate.
Consider a real-life example – earthquakes – to understand the importance of examining the distribution (or pattern) of combinations of risk probability and risk impact.
Being specific about consequences is important: whilst there are thousands of small earthquakes globally, there have only been around 500 since 1900 that have exceeded 3 on the Richter scale. These are shown in Figure 3
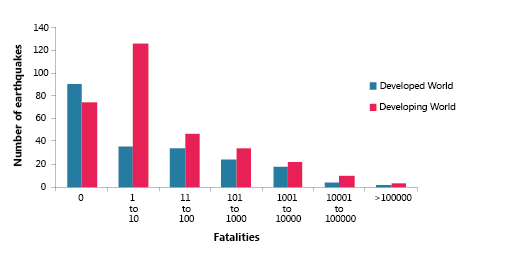
Of those 500, in approximately 17% of cases there were no fatalities, and in a further 34% of cases there were fewer than 10 fatalities, meaning that in 51% of earthquakes there were few fatalities. In 15% of earthquakes there were 1000 or more fatalities. However, the view can change depending on location in the world (and the data chosen to use). Figure 4 shows just the data from 1900 to 1950.
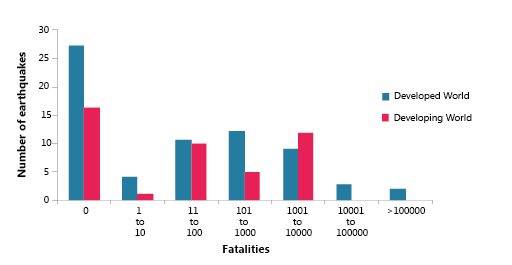
If you just look at data up to 1950, then 37% of earthquakes killed in excess of 1000 people, with people in the ‘developed world’ being the most impacted. Perhaps because of better recording or perhaps because of greater earthquake activity, but the picture for the second half of the twentieth century and early twenty-first century is very different, as shown in Figure 5
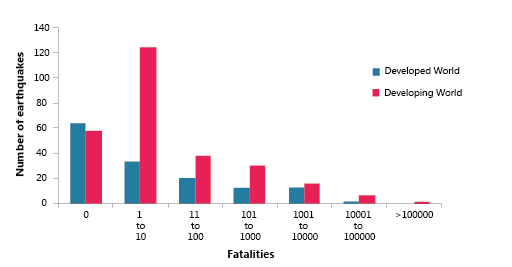
Since 1950, earthquakes in the developed world where more than 1000 people die make up just 2.8% of the total. Worryingly for those in the developing world, while earthquakes that kill over a 1000 people since 1950 in these regions represent 4.2% of the total, earthquakes that kill over 10,000 people represent 2% of the total. Thus very large-impact earthquakes in the developing world are almost as prevalent as a lower-impact event in the developed world. A large portion of the difference potential is due to controls, which will be covered in treatment.
These risks and their impacts are often shown as a distribution. In such cases it can often be very important to understand the shape and nature of the distribution; in certain circumstances it may be appropriate to capture multiple pairs of probability and impact to properly describe the risk faced. This can prove to be particularly important where different treatment approaches will be required. There will be more on this in Session 5.
Distributions such as these are often used in the financial services industry – for example, in credit scoring. In this area, a plot of the distribution of credit scores versus loan default rates can be used to assess the risk of default based on approving loans relative to a certain credit score.