

5 Measuring inequality
The ‘egalitarian ideal’ that has dominated left-leaning thinking since the 1960s is repeatedly challenged by a counterargument that people are not obsessed by fair outcomes, but accept even wide disparities of income and wealth if they are believed to be based on talent, effort and fair processes.
Both sides of this argument use data, produced by governments and global organisations such as the United Nations, as this can be a powerful tool for those who wish to engage with the arguments.
However, as you saw in Section 4.1, global inequality is most certainly falling; but within countries, the richest are still pulling away from the rest.
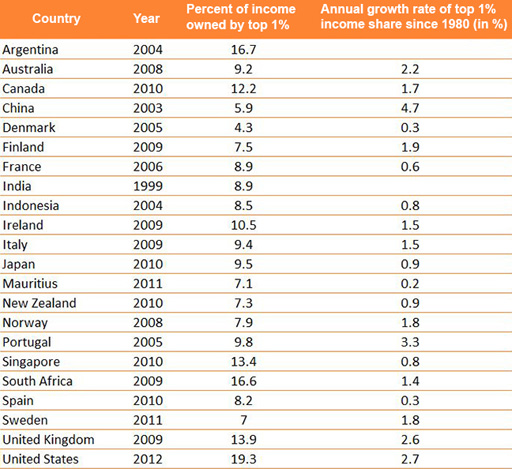
The United States of America is still the country with the wealthiest 1 per cent (United Nations, 2013). In the USA, the average income of the top 5 per cent increased at an annual rate of 1.5 per cent between 1980 and 2011. In contrast, the average real income of the bottom 99 per cent of income earners grew at an annual rate of only 0.6 per cent between 1976 and 2007 meaning the top 1 per cent captured 58 per cent of income growth through those decades.
The report by Alvaredo et al. (2013) addresses a common misunderstanding about the relationship between economic development and inequality.
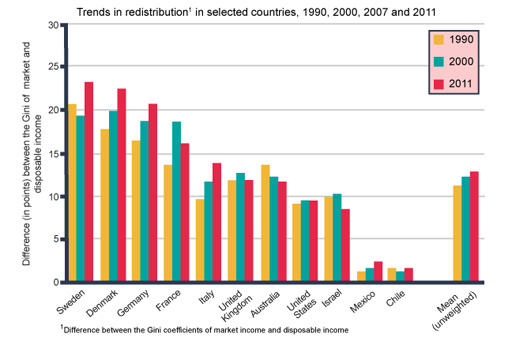
Figure 12 shows how Scandinavian countries, which already have the least inequality in the developed world, are continuing to make progress towards more equal societies.
The debate continues about whether inequalities are best tackled by government intervention or market forces. As the UN (2013) report illustrates, most of the world’s poor, and people in marginalised groups, start life in highly disadvantaged positions, but inequality can be reduced. However, national attitudes with regard to the role of the state and the role of markets will continue to determine the extent to which addressing inequalities tops a particular country’s priority list.
In the next section, you will find out about social mobility and inequality.