5.2 Deducing the culprits
Now for Step 6 of the whodunnit, the final step. Of our suspects, who are the culprits?
In other words, how strongly does the Sun, the greenhouse gases, and the red herrings affect the temperature record? What is the relative contribution of each factor and how much of this contribution can be explained by human activities?
Using climate models, scientists estimate the fraction of influence from each climate fingerprint by adjusting their contributions until they find the ‘best fit’ to the observed data. You need a mix of all these unique fingerprints in the right amounts and once you have the best fit to the data, you have your best estimate of the fractions of each.
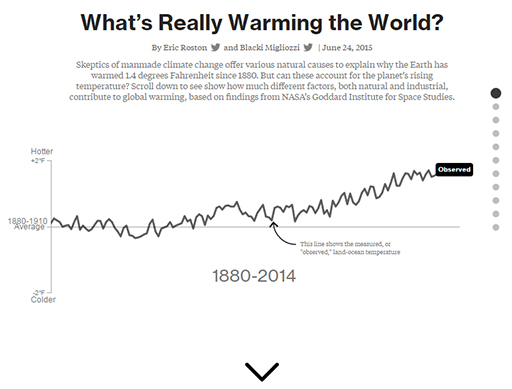
Using the down arrow, scroll through Figure 14 to see how this looks in GMST for the forcings you have studied (plus a few others).
It is clear from the individual time series of GMST for each forcing (Figure 14) and their differing fingerprints that human activities are the main cause of recent warming.
As you learned at the start of this session, some degree of uncertainty is inevitable in attribution, because establishing cause and effect relationships in complex natural systems is difficult. But the IPCC (2013a) statement that
‘Scientists are 95% confident that at least half the global warming since 1950 is due to human activities’
is actually quite a conservative summary of scientific studies.
In fact, the best estimate is that human activities have caused all the warming since 1950 through increased greenhouse gas emissions.

