

2.1 Change in surface air temperature
You decide to tell the minister the key message relating to Figure 3. Read the caption and accompanying text carefully first.
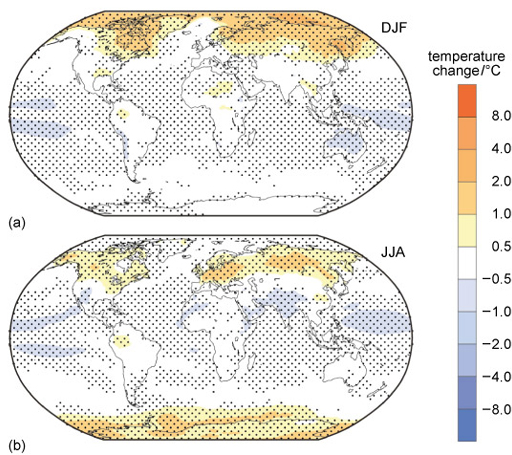
The figure shows the mean predictions of surface air temperature change in the winter and summer from twelve climate models. Stippled areas show where at least nine out of the twelve models agree on the sign of the change (e.g. for stippled yellow/orange/red areas, most models show warming). In the scenario shown in this figure, atmospheric CO2 concentrations are increased to four times preindustrial levels (which is written 4 × CO2 forcing The warming effect is cancelled by the equivalent reduction in the incoming solar radiation, so that the global temperature is the same as in the preindustrial climate.
Key scientific points are:
- The figure shows predictions of surface air temperature change since preindustrial in the winter and summer from an average of multiple climate models.
- Even though the 4 × CO2 forcing is exactly balanced by a reduction in solar radiation, there are still changes relative to the preindustrial climate.
- Most areas show less than 0.5 °C of warming or cooling (i.e. white areas), but many regions are warmer than this and some are cooler.
- Most of the map is stippled, which shows that the models generally agree on which areas will warm or cool.
Activity 1
What will be your key message to the minister, based on the information in Figure 3?
Answer
There is no correct answer, but one message to the minister might be:
‘We found that even if we reduced the solar radiation reaching the Earth to exactly balance the increased CO2, the temperatures weren’t the same as if we didn’t have the extra CO2’
The minister wants to know more …
Write down one or two sentences explaining the main pattern of change.
Answer
Here is one possible answer:
‘Most models predict that many northern areas would be warmer than the preindustrial climate by a degree or more, particularly in the winter.’
The minister then asks: ‘Interesting. Why is the climate not the same as with no CO2?’
Write down two more sentences: one to explain why, and one about what would be required to return to the original climate. Remember to keep it simple.
Answer
Your answer might be:
‘Greenhouse gases and the Sun affect the temperature of the atmosphere in different ways. So the only way to get back to the original climate is to extract CO2 from the atmosphere – with carbon dioxide reduction methods, like bioenergy with carbon capture and storage.’