

2.1 Global warming through time
Activity 2 Global warming
What do you understand by the term ‘global warming’?
Answer
In brief, thousands of land measurements made over time and in different places are combined into a single, globally averaged temperature. An upward trend in the globally averaged temperature is referred to as global warming.
Climate scientists use the term global mean surface temperature (GMST) to describe the globally averaged temperature. This plays a key part in our current knowledge about climate change.
-
Read the following statement from the IPCC and guess the missing value:
The amount of global warming in the period 1880–2012 is ___ degrees Celsius (IPCC, 2013).
-
The amount of global warming in the period 1880–2012 is 0.85 degrees Celsius (IPCC, 2013). How close were you? Scientists need to be able to make sensible ‘guess-timates’, and practice helps to improve that skill. You should also note that, in many cases, changes measured in climate are surprisingly small, although their impact may be large.
The full statement from the IPCC also has an uncertainty range. They estimate there is a 9 in 10 chance of the temperature change being between 0.65 and 1.06 degrees Celsius. So, if your guess was in this range, or a little bit outside, you were also right!
Figure 4 shows the observed changes in global mean surface temperature (GMST) for the period 1850–2012 in degrees Celsius (IPCC, 2013).
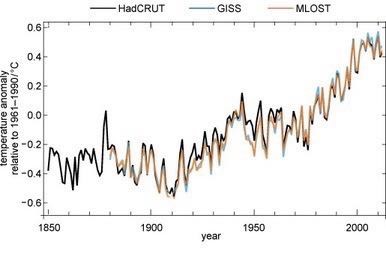
The x-axis is the year. Each of the data points is an annual mean: the mean of one year of data. The data points are joined by lines to show the changes more clearly.
The y-axis is ‘temperature change relative to 1961–1990 in degrees Celsius’. This is the temperature change relative to the average temperature during the 30 years of what we term as the baseline period of 1961–1990. The average temperature over this period is zero on the y-axis.
You can see there has been an overall upward trend in GMST. There are also short-term large fluctuations over about one to three years, which are known as interannual variability.
The video below shows another powerful way of communicating the same data: through music.

Transcript: Video 1 A Song of Our Warming Planet by Daniel Crawford.
Global warming of 0.85 °C in around 160 years does not sound like much. But humans do not feel global mean temperature: we feel local changes, and we are most affected by extremes (the hottest and coldest days).