

3.1 Rain
Rain is particularly important for geoengineering because living things are very sensitive to the amount and intensity of rain they receive. A broader term for rain is precipitation, the collective word for all forms in which water from the air falls under gravity onto the Earth’s surface (rain, snow, sleet or hail).
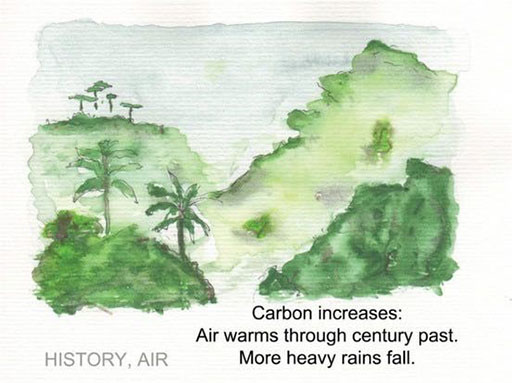
The haiku – a Japanese style of poem – in Figure 6 summarises three IPCC (2013) assessments of how climate change has affected rainfall:
- The atmospheric concentrations of the greenhouse gases carbon dioxide, methane, and nitrous oxide have all increased since 1750 due to human activity (‘Carbon increases’).
- The globally averaged surface temperature data show a warming of 0.85°C over the period 1880–2012 (‘Air warms through century past’).
- Since 1950, there are likely more land regions where the number of heavy precipitation events has increased than where it has decreased (‘More heavy rains fall’).
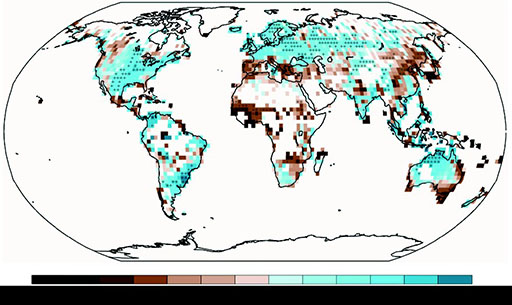
The third statement refers to heavy precipitation events, which can cause devastating effects to human health and infrastructure. But changes to average rainfall – whether increased or decreased – are also important. Too little rainfall over a long period, for example, and supplies for drinking, agriculture and hydroelectric power can be at risk. Figure 7 shows the changes that have happened since the middle of the twentieth century.
-
Which regions tend to have become wetter or drier: the most or least developed countries?
-
The regions that have increased rainfall tend to be the more developed countries, and those that have decreased rainfall tend to be the least developed.