

3.4 Sea level rise
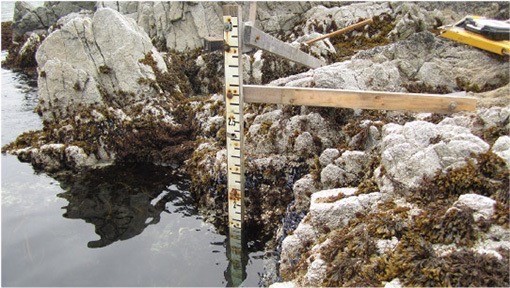
Tide gauges on coasts and islands have measured sea level, relative to a fixed benchmark on land, for more than 150 years. The oldest measurements date back to the 1700s and consisted of visual observations of water level against a calibrated vertical pole known as a tide staff (Figure 11). Today, sea level is also measured by other methods including buoys and satellites.
The measurements show, as you might already expect, that global sea level is rising (Figure 12).
Many people live in low-elevation coastal zones, and sea level rise increases the likelihood of coastal flooding. The IPCC assesses there is around a two-in-three chance that extreme high sea levels have increased since 1970.

A number of factors contribute to sea level rise – not only glaciers and the Greenland and Antarctic ice sheets, but also thermal expansion and transfer from land water storage.
Thermal expansion is water in the oceans expanding as it warms.
Transfer from land water storage is the movement of water that was previously stored on land into the oceans. The main reason for this is that humans have been extracting groundwater (water stored in the soil and rock) for agriculture, industry and drinking water. After it is used, it runs off into the rivers and eventually the oceans. Changes in land water storage also include capture of water in reservoirs, which removes water from the oceans (lowering sea level).
Some factors contributing to sea level rise hit the headlines more than others, but this does not necessarily correspond to how much they contribute to sea level rise. Guess the rank of these factors in terms of their contribution to sea level rise for the period 1993–2010. Rank 1 is ‘greatest contribution’ and rank 5 is ‘smallest contribution’:
You might be surprised at the answer, from 1993–2010:
- thermal expansion contributed 1.1 mm per year to sea level rise
- glaciers contributed 0.8 mm per year
- land water storage contributed 0.4 mm per year, and
- the Greenland and Antarctic ice sheets contributed around 0.3 mm per year each, making a total of around 3 mm per year.
But what do these changes mean for life on our planet?