2.1 The Sun
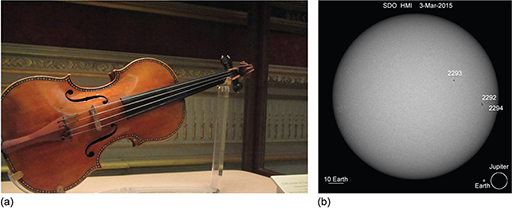
Stradivarius violins are considered to be among the finest in the world (Figure 2a). Some experts have suggested this is partly down to the density of the wood in their construction (Stoel and Borman, 2008), and that is different because it is spruce wood grown during the unusual climate at the time they were made (Burckle and Grissino-Mayer, 2003).
Antonio Stradivari was born in Italy in 1644, a year before the start of the Maunder Minimum. This was a 70-year period during which the Sun had abnormally few sunspots, named after the husband-and-wife pair of astronomers who identified the phenomenon. Sunspots (Figure 2b) are areas of intense magnetic activity and they correlate with the intensity of solar radiation: the more sunspots, the greater the Sun’s output.
So the trees surrounding Stradivari’s workshops had grown during a long period of unusually cool climate. Trees grow more slowly in cooler climates, which makes the wood density higher and more uniform between summer and winter growth. To what extent the Sun’s variations contributed to Stradivarius violin sound quality is unknown: but the effect of solar changes on climate is certainly real.
The Maunder Minimum was one contributing factor to the Little Ice Age (around 1450–1850), a cool interval during which a number of mountain glaciers expanded. But this is not the only example of a changing Sun. Solar radiation has long-term variations – which are essentially unpredictable – and more regular short-term changes, such as an 11-year cycle.
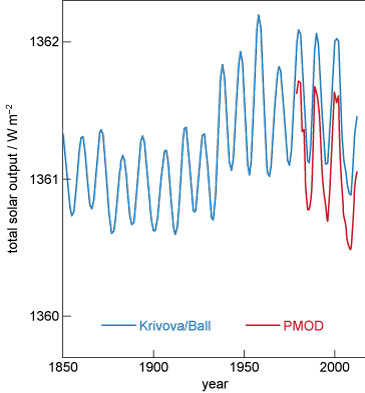
Step 4 of the whodunnit requires an estimate of how solar radiation reaching the Earth, also known as total solar irradiance, has changed through time. Figure 3 shows two estimates of past changes in total solar irradiance: the longer record is estimated indirectly from sunspot number and characteristics, while the shorter, recent record is from satellite observations. It clearly shows the 11-year cycle, along with longer-term changes.

-
What are the long-term changes in total solar irradiance over the twentieth and start of the twenty-first centuries?
-
Total solar irradiance increases in the first half of the twentieth century. It then stays fairly constant (aside from the 11-year cycle), with a decrease at the start of the twenty-first century.

