

2.2 Greenhouse gases
The Earth’s surface is warm, so it emits energy in the form of radiation. Much of this energy is infrared. Certain gases in the atmosphere absorb infrared radiation: this means that most of the infrared radiation from the Earth’s surface is trapped and recycled by the atmosphere, being repeatedly absorbed and re-emitted in all directions by the greenhouse gases.
These greenhouse gases (GHGs) include carbon dioxide (CO2), methane (CH4), nitrous oxide (N2O), ozone (O3) and water vapour. You will look at the first three of these gases.
The additional energy keeps the Earth’s GMST over 30 °C warmer than it would be without an atmosphere: without the greenhouse effect, there would not be life as we know it. What matters for recent and future climate change is how much the greenhouse effect is enhanced by our activities.
The human sources of greenhouse gases include:
- CO2 – mainly as a by-product from fossil fuel burning for energy, and cement production for construction, with some from land use changes such as deforestation.
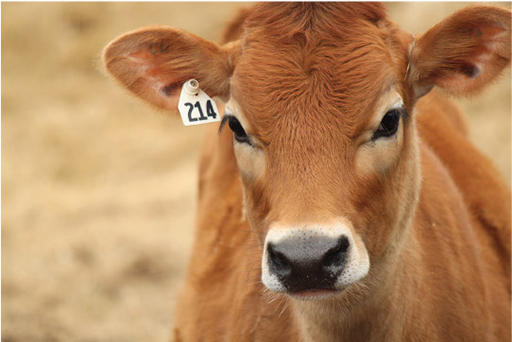
- CH4 – rice paddies, livestock flatulence and burping (Figure 4), waste management (e.g. organic matter rotting in landfill sites), leakage from gas pipelines, venting gas at oil production sites and coal mines, and burning vegetation.
- N2O – mainly from agriculture, such as the application of fertilisers; some also comes from combustion of fossil fuels and vegetation.
Continuous direct monitoring of atmospheric CO2 concentrations dates back to 1958, and direct continuous measurements of CH4 and N2O began only in the 1980s. Before this, measurements of past GHG concentrations mostly come from bubbles of air trapped in ice core samples taken from the polar regions.
Figure 5 shows the amounts of the three GHGs since 1850 in terms of mixing ratios. The mixing ratio is the proportion of a given gas in the atmosphere, usually referred to as the atmospheric concentration. Values are usually in parts per million (ppm) or parts per billion (ppb). Hover over a data point to see the year and concentration value.
-
What can you tell from the graph about the concentrations in the atmosphere of these three greenhouse gases?
-
You can see from the graph that concentrations of all three are increasing as year increases.
-
What are the year and concentration for the final point of the CO2 data? What are they for the first point?
-
The final data point on the CO2 (black) curve is 398.6 ppm, in 2014. The first point is 286.8 ppm, in 1850.
-
Which of the three GHGs has shown the largest percentage increase from 1850 to 2011?
-
Methane has exhibited the largest percentage increase in concentration since 1850. It is the only one for which the rise (from around 800 ppb to 1800 ppb, an increase of around 1000 ppb) is larger than the original value. For the other two, the increase is smaller than the original value.
This may be surprising, as CO2 is the most well-known greenhouse gas. The reason CO2 is the focus of most discussion around climate change policy is because it has the highest concentration of the three GHGs (measured in parts per million, not parts per billion). It is therefore the largest contributor to total greenhouse gas forcing.