Skip to content
Skip to main content

About this free course

Download this course

Share this free course

Could we control our climate?

Start this free course now. Just create an account and sign in. Enrol and complete the course for a free statement of participation or digital badge if available.

2.2 Rainfall

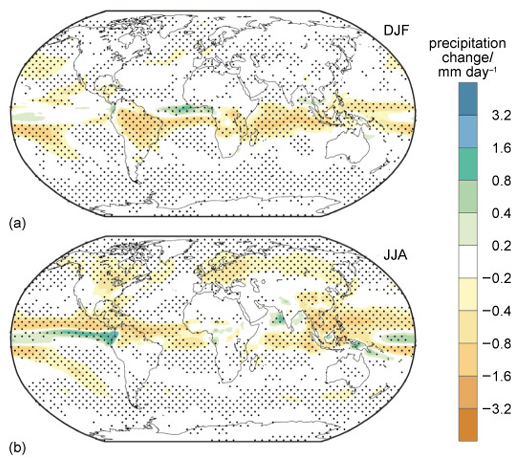
As you have seen, changes in rainfall are arguably more important to people than temperature. So now do the same again but for precipitation (Figure 4).

Figure 4a is a map of the world. It shows precipitation changes, averaged over 12 climate models, for the period December to January. The changes are colour coded (full-details in the caption). The biggest increases are across the tropical latitudes (approximately 0.8-1.6 millimetres per day change), specifically the Atlantic between Africa and South America and the mid-Pacific. The biggest decreases are across sub-tropical latitudes (approximately -3.2 -1/6 millimetres per day), specifically South America, sub-Saharan Africa, the Indian Ocean and the South Pacific. Figure 4b is a map of the world. It shows precipitation changes, averaged over 12 climate models, for the period June to August. The changes are colour coded (full-details in the caption).
Figure 4 Same as for Figure 3 but for the change in precipitation (in millimetres per day, mm/day). (IPCC, 2013)

Activity 2

Timing: Allow approximately 10 minutes

What will be your key message to the minister, based on the information in Figure 4?

To use this interactive functionality a free OU account is required. Sign in or register.
Interactive feature not available in single page view (see it in standard view).

Answer

This could be a very similar key point to the temperature example, so maybe:

‘We found that even if we reduced the solar radiation reaching the Earth to exactly balance the increased CO2, the rainfall patterns weren’t the same as if we didn’t have the extra CO2.’

Write down one more sentence explaining the main pattern of change for precipitation.

To use this interactive functionality a free OU account is required. Sign in or register.
Interactive feature not available in single page view (see it in standard view).

Answer

One answer – concentrating on land areas, because these are likely to be the regions that policy-makers are focused on – might be:

‘Most models predict the tropics will be drier by around half a millimetre a day all year round – and that northern high latitudes are also a bit drier in the summer.’

But these results are from models. How do we know if this will work in reality?