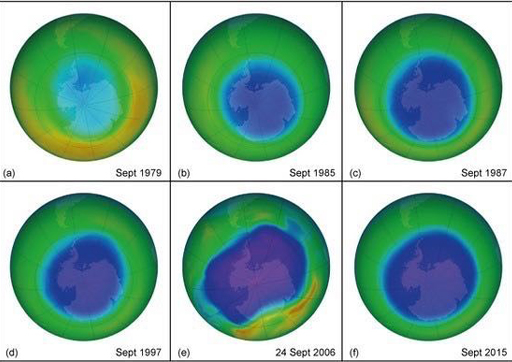
Skip to content
Skip to main content

About this free course

Download this course

Share this free course

Could we control our climate?

Start this free course now. Just create an account and sign in. Enrol and complete the course for a free statement of participation or digital badge if available.

3.2 Ozone loss

You saw in Session 3 that ozone (O3) is among the greenhouse gases in our atmosphere. As well as absorbing infrared radiation, ozone absorbs most of the Sun’s ultraviolet radiation, shielding us from its harmful effects such as skin cancer. Ozone depletion by human use of chlorofluorocarbons (CFCs) was a major environmental issue of the late 1980s until the Montreal Protocol restricted the use of ozone-depleting substances. The increasing size of the ‘ozone hole’ and recent signs of recovery can be seen in Figure 6.

This figure shows 6 colour coded satellite images of the amount of Ozone over the South Pole. Colours are coded from blue/purple to green to red yellow for increasing amounts of ozone. The globes are shown predominantly in green. Figure 6a is the mean for September 1979 and shows a pale blue region over Antarctica and an orange region around Antarctica. Figures 6b, c, d and f show means for September 1985, 1987, 1997 and 2015 respectively. Each has a dark blue/purple circular region around Antarctica. Figure 6e shows data for 24th September, 2006, showing the dark blue/purple region extending well beyond Antarctica, with a fringe around part of it in yellow/red.
Figure 6 False-colour image of ozone over the South Pole in different years. All show the mean for September, the month of the typical spring minimum, except (e) which is a single day. Blue and purple colours show areas with less ozone, and yellows and reds more ozone. (a) 1979, the start of the records. (b) 1985, the year in which springtime Antarctic ozone losses were first published. (c) 1987, the year of the Montreal Protocol. (d) 1997, a decade later. (e) 24 September 2006, one of the days with the largest observed ozone hole size. (f) 2015

CFCs deplete the ozone layer through a cycle of reactions started by light. When CFCs are broken down by UV radiation from the Sun, this produces highly reactive chlorine atoms that react with ozone and destroy it. This is a very destructive process and a single chlorine atom can continue to deplete ozone until it reacts with something different, such as nitrogen oxides.

Sulfate aerosols pose a risk to the ozone layer because they react with nitrogen oxides. This reduces one mechanism of removing chlorine atoms, the result is the amount of chlorine increases, and therefore ozone depletion increases.

One small silver lining is that this risk should become less important. The 1987 Montreal Protocol has been effective in reducing chlorine in the atmosphere from CFCs, so the sulfates will eventually no longer be able to amplify their effect on the ozone layer (Keith, 2013, p. 68).