

1.1 The trends
Media headlines frequently announce the existence of a global mental health crisis and that mental health issues in adolescence are on the rise. Is the mental health of young people really poorer than it was, say 20 years ago? Until the 2017 survey, presented in the first activity, data on under-fives and 16 to 19-year-olds was not collected, so trends over time are only available for the age range 5-15 years. In the next activity, you’ll look at the graph in Figure 3, which shows data from surveys of the mental health of 5 to 15-year-olds in England carried out in 1999, 2004, and 2017.
Activity _unit2.1.2 Activity 2: Examining the trends
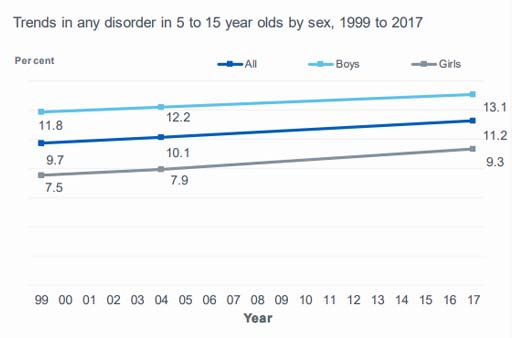
The dark blue line, showing the average between boys and girls, indicates that in 2017 11.2% of 5 to 15-year-olds reported at least one mental health ‘disorder’.
In the first activity, you saw that 12.8% 5 to 19-year-olds had at least one mental health ‘disorder’ in 2017.
Can you see why the percentages are different?
Discussion
The trends graph is based on 5 to 15-year-olds and the figure in Activity 1 was based on 5 to 19-year-olds, a wider age group. We know that 17 to 19-year-olds had the highest incidence of mental disorder (16.9%) so when added to the statistics for 5 to 15-year-olds, they will raise the overall average. It’s important when looking at trends over time that the data sources are consistent. In this case, the NHS Digital team needed to pick out the 5 to 15-year-olds from the 2017 data to make the comparison with the previous surveys.
The graph you’ve just looked at shows a steady increase in mental disorders since 1999. There is a marked difference between boys and girls, with a noticeably higher percentage of boys experiencing a mental disorder compared with girls. Looking at this graph, you may conclude that we should be more concerned about boys than about girls. However, these figures, which pool all ages, are hiding some interesting detail!