Week 7: Working with data
Introduction
More and more in every aspect of our lives, data – information, numbers, words or images – are collected, recorded, analysed, interpreted and used. For example, every time you go shopping, if you use a loyalty card, the store will be collecting details of what you purchased to help them to provide you with a better service and keep your custom. Information is also encountered in the form of statistics: everything from graphs of the latest house sales figures to census results, the current rate of inflation or the unemployment rate.
This week you'll consider how to summarise a set of data using averages to provide a typical value for that data. You’ll also think about the importance of full information about the average that has been used and how to read and construct tables of data.
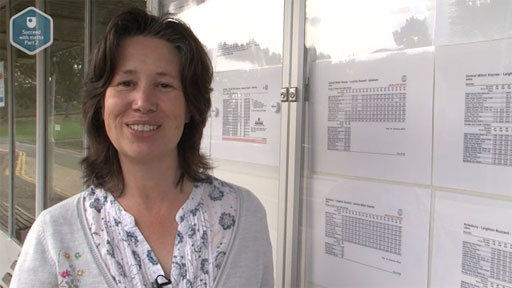
Watch Maria introduce you to the penultimate week of the course, Week 7:

Transcript
After this week’s study you should be able to:
- calculate the average for a set of data using the mean, median and mode
- calculate the range of a set of data
- understand that different averages may give different results for the same set of data
- read and construct tables.
