

1.3 Calculating the median value of a data set
The median is defined as the middle value of a data set when all the data is arranged in numerical order. If there is an even number of values, and therefore no middle value, then the median is calculated as the mean value of the two middle values.
So, let’s now see how using the median, rather than the mean, affects the value for the average rainfall in Vermont. Here’s a reminder of the data:
| Year | 2007 | 2008 | 2009 | 2010 | 2011 |
|---|---|---|---|---|---|
| Rainfall, in inches (to 1 d.p.) | 5.8 | 5.2 | 4.6 | 9.3 | 4.5 |
To find the median rainfall, first arrange the data values in numerical order, to give:
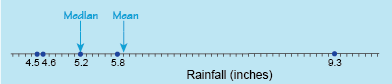
4.5 4.6 5.2 5.8 9.3
There are five data values, an odd number, so the median is the middle value in this case. Therefore the median rainfall is 5.2 inches.
If you look at the number line again in Figure 2, with the median added this time, it appears that the median may be a better choice for an average or typical value in this case:
Now try out the next activity.
Activity 3 A computer game for Charlie
Over the course of one week Charlie plays her computer game every day except Friday, and achieves the following scores:
| Monday | Tuesday | Wednesday | Thursday | Saturday | Sunday |
| 250 | 270 | 300 | 290 | 290 | 270 |
- a.Find Charlie’s mean score over these seven days.
Answer
a.To find the mean, find the sum of the scores and divide by the number of scores, six.
Charlie’s mean score = 250 + 270 + 300 + 290 + 290 + 270 = 278 (to the nearest whole number).
- b.Find Charlie’s median score over these six days. (Click on reveal comment if you would like a hint)
Comment
There is an even number of data values this time, so to find the median calculate the mean of the middle two values.
Answer
b.To find the median score, arrange the data values in order:
250 270 270 290 290 300
There is an even number of values (six), so Charlie’s median score is the mean of the two middle values, 270 and 290.
- c.How do the median score and the mean score compare in this case?
Answer
- c.This time, the mean and median scores are very close. This is because the data values are fairly evenly clustered around the mean value without any extremely high or low values.
Having covered the mean and median, this leaves just the mode to consider in the next section.