

2 Measuring the spread of a data set
As well as finding a typical value or average for a set of data, it is also useful to see how the data values are spread about the typical value. Here’s an example to start exploring why this is.
Last year, Sam grew two varieties of sunflowers and measured the heights of the flowers in inches. Here are Sam’s results:
| Variety A | 60 | 59 | 66 | 55 | 55 | 62 | 58 | 65 |
| Variety B | 52 | 69 | 61 | 60 | 54 | 67 | 50 | 67 |
Sam wants to compare how each sunflower variety performed based on height, so wants to look at the data in more detail.
Activity 5 How tall are the sunflowers on average?
- a.Find the mean height of the sunflowers of variety A.
Answer
- a.
- b.Find the mean height of the sunflowers of variety B.
Answer
b.On average, the sunflowers of the two varieties are the same height: 60 inches.
When Sam looked at the sunflowers, they did look about the same height on average, but there was still a difference. To investigate this difference have a look at the heights plotted on number lines in Figure 3.
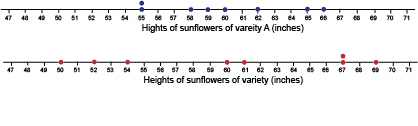
The blue dots represent the heights in inches of the sunflowers of variety A, and the red dots represent the heights in inches of the sunflowers of variety B. You should be able to see that the red dots are more spread out than the blue dots. This means that heights of sunflowers of variety A are more consistent (closer together), than the heights of the sunflowers of variety B, which are more variable (more spread out). If you had only looked at the mean value this would not have been evident. This shows how useful it is to look at the spread of data as well as the average.
One way of measuring the spread of a data set is called the range. The range is calculated as follows:
Range of data set = largest value – smallest value
For the sunflowers of variety A, the smallest value is 55 inches and the largest value is 66 inches.
So the range for variety A = 66 – 55 = 11 inches
The smallest value in the data set for variety B is 50 inches, and the largest value is 69 inches.
So the range for variety B = 69 – 50 = 19 inches
So even though both sunflower varieties had the same mean height, there was much more variation – that is, a wider range – of heights seen in variety B compared to variety A. If you grew sunflowers commercially, knowing this about a particular variety would be very useful at harvest time!
The range gives an idea of the spread of the data, although it can be affected by either very high or very low values. There are other ways of measuring the spread of a data set, and you’ll meet these if you continue studying mathematics or statistics.
The next section gets you thinking about what questions to ask when you are presented with averages