2 Line graphs
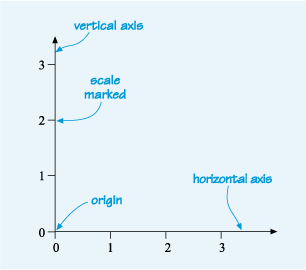
Line graphs are constructed by plotting points on a grid. Figure 4 shows two lines at right angles to each other that set up a grid. These are called the horizontal axis and the vertical axis. Each axis is marked with a scale, in this case from 0 to 3. The point where the two axes meet and where the value on both scales is zero is known as the origin. (Note: ‘axes’ is the plural form of ‘axis’.) This is not only the basis for all line graphs, but also for bar charts.
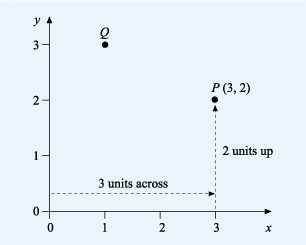
In Figure 5, the horizontal axis has been labelled with an ‘x’ and the vertical axis with a ‘y’. This is because the horizontal axis is usually known as the x-axis and the vertical axis as the y-axis.
The location of any point on the grid by its horizontal and vertical distance from the origin. These are always shown with the horizontal distance first and in the form (x,y), where x and y are the respective distances from the origin to the point. This is known as the coordinates of the point. The horizontal distance being the x-coordinate and the vertical distance the y-coordinate.
Look at point P in Figure 5. To get to point P from the origin, you move three units across and two units up. Alternatively you can say that point P is opposite 3 on the x-axis and 2 on the y-axis. This gives us the coordinates for P of as (3,2), with an x-coordinate of 3 and a y-coordinate of 2.
In the same way, point Q is one unit across and three units up, so Q has coordinates (1, 3).
coordinates do not need to be positive numbers though. You’ll see in the next section how both the x and y axes can be extended to include negative numbers, just as a number line can.


