

2.3 Decimal coordinates
Marking a scale with fractions of whole units allows us to plot points using decimal coordinates such as (1.8, –2.1).
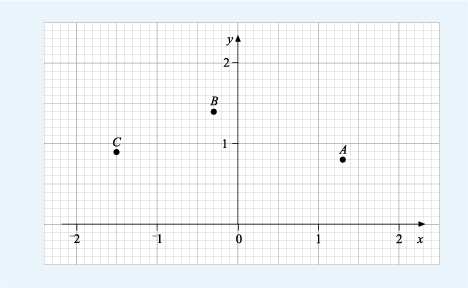
In Figure 9 below, each unit along the axes has been divided into ten, so each grey line represents a tenth of a whole unit, or 0.1. Point A has the coordinates (1.3, 0.8), as it is plotted 1.3 units across to the right of the origin and 0.8 units up.
Now, we’ve done the first point for you, complete the coordinates for the other points shown in the next activity.
Activity 3 Reading decimal coordinates
Write down the coordinates for the points B and C on the graph above.
Answer
B is plotted at the point which is 3 intervals to the left of the origin on the horizontal scale and 4 intervals past the 1 mark on the vertical scale, i.e. opposite -0.3 on the x-axis and opposite 1.4 on the y-axis. So the coordinates of B are (-0.3, 1.4)
Similarly, the coordinates of C are (-1.5, 0.9).