

2.6 Using a graph
As well as providing a visual representation of data, a graph can be used to infer more information than the data that you started with.
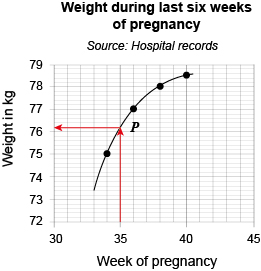
Look again at the change in weight of a woman during the last six weeks of pregnancy. Since you would expect the woman’s weight to change steadily between hospital visits, it is possible to use the graph to estimate her weight at other times during the six weeks.
For example, to estimate her weight at 35 weeks, first find 35 on the horizontal axis. Then from this point, draw a line parallel to the vertical axis, until the line meets the curve at point P. From P, draw a line horizontally, to meet the vertical axis. Read off this value: in Figure 13, it is about 76.2 kg.
Determining values between the plotted points is known as interpolation.
Activity 5 Reading a value from a graph
Use the graph above to answer the following.
It may be helpful to print this page with the graph, so that you can draw lines on the graphs to identify values. You may also use an object with a straight edge, such as a ruler or piece of paper, and hold it up to your monitor to help you visualise where certain points appear in relation to the axis.
- a.What is the woman’s weight at 37 weeks?
Answer
a.Find 37 on the horizontal axis and draw a line vertically up to the curve. Then draw a line horizontally from this point to intersect the vertical axis. This value is approximately 77.6 kg.
The woman’s weight at 37 weeks is estimated to be about 77.6 kg.
- b.When do you think the woman’s weight was 76 kg?
Answer
b.Find 76 kg on the vertical axis. Draw a horizontal line to meet the curve. Then draw a line vertically down to meet the horizontal axis. Read off the value: it is just below 35 weeks.
So the woman’s weight is estimated to have been 76 kg in week 34.
As well as inferring other data from the graph in some cases it is possible to estimate the coordinates of points that lie outside those plotted. This is known as extrapolation. However, you must be confident that the graph continues in a similar manner so you do need to be cautious: you cannot be certain that patterns shown in graphs will continue.
For instance, in our example it would not be sensible to extrapolate beyond 40 weeks, as this is the usual length of a normal pregnancy.
The graph can also be used to determine the overall trend in the data — that is, how one value is changing with the other. In this case, the graph shows that the woman gained weight quite rapidly between weeks 34 and 36, but from week 36 to week 40 she gained less.
So, careful use of a line graph can prove a very powerful tool when investigating collected data.
The next section looks at bar charts and the different ways these can be drawn, depending on the data that you have and what you want to show.