3.3 Introducing the Capital Asset Pricing Model (CAPM)
So far you have looked at diversification across shares, and how this can be achieved by collecting shares in funds. But compared to other assets, shares can involve high levels of both risk and return. In this section, you will consider how a less risky portfolio can be put together by combining shares with a risk-free asset.
A key model in investment analysis is the Capital Asset Pricing Model (Sharpe, 1964), also called the CAPM. It makes three additional assumptions to those assumed thus far in our development of portfolio theory, and leads to some pretty startling conclusions for fund management. The additional assumptions are that:
- All investors are looking at the same risk–return diagram.
- There is a risk-free asset that is risk-free for us all. The closest we can get to a risk-free asset is a government bond (in the UK, gilts).
- Investors can borrow and lend at the same risk-free rate. We know that this has to be unrealistic, but allowance for differences in borrowing and lending rates makes the model that much more complicated.
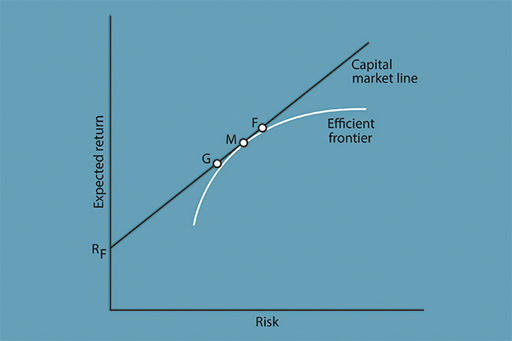
These assumptions are captured in Figure 6. As before, this is a diagram showing combinations of risk and return associated with different portfolios. The risk-free rate of return is represented by R F. This could, for example, be a yield of 3% on a government bond. Note that there is no risk attached to this investment, hence its location on the vertical axis. An investor could choose to put their entire portfolio into the risk-free asset, yielding the return R F at no risk. Notice also that a straight line has been drawn on the figure above that starts at R F. This is called the capital market line. As we move along the line, risk-bearing shares (in proportions to be explained shortly) are added to the portfolio.
Assume that the investor has £100 to invest at the outset. At R F, the investor puts all of the £100 into a portfolio made up of only the risk-free asset. But at G, the investor holds only £20 in risk-free government bonds, and the other £80 in shares. This increases both the expected return and risk associated with the portfolio.
The investor could alternatively put all of the £100 into shares at M, which is a point on the efficient frontier that touches the capital market line in the figure above. Now, it has been assumed that all investors are looking at the same diagram, which leads them to reach the same conclusion: that the most efficient combination of shares is to hold M since it is a point on the efficient frontier.
Since all investors will hold M in some proportion in their portfolios and, for the economy as a whole, investors hold all shares in the stock market, the portfolio M must include all shares in the stock market in proportion to their market value. This is called the market portfolio. By choosing this efficient outcome the investor diversifies away all specific risk associated with the individual shares held in the portfolio. Only systematic (market) risk is incurred.
At M the investor does not hold any of the risk-free asset: all of the £100 is invested in a market portfolio of shares. Hence the line between R F and M represents combinations of the risk-free asset and the market portfolio of shares. Under the CAPM, investors choose the combination between these assets that most suits their appetite for risk and return. The choice is between zero risk at R F or full exposure to market risk at M.
It is important to emphasise that even at G, where only £80 is invested in shares, these shares will consist of the market portfolio (based on the stock market as a whole), in which there is only systematic risk. All that varies, at this stage in our analysis, is the amount of money invested in this market portfolio, and hence the amount of systematic risk.
The CAPM also allows for the investor to borrow. Assume that the investor could borrow £10 and use this to buy more shares: an expanded market portfolio of £110. Moving further along the capital market line to point F in the figure above, the investor has further increased expected return and risk. By borrowing money to invest in shares, the investor has taken on more systematic risk.
What the CAPM essentially says, is that investors get rewarded only for taking on systematic risk. So, provided that all the assumptions underlying the model hold, investors can only expect a return for bearing systematic risk. There is no point in taking on specific risk, as there is no expectation of any additional return for this. According to the CAPM, investors should hold efficient portfolios made up of M and the risk-free asset. Unlike the Markowitz approach, which leaves it open to each investor to hold their own tailor-made portfolio, the CAPM says that we should all hold different proportions of the risk-free asset and of the same risky portfolio of shares (that is, the market portfolio, M).
Activity 3.1 A portfolio example
a.
£62 to Gelato; £38 to Hotchoc
b.
£80 to Gelato; £20 to Hotchoc
c.
£30.40 to Gelato; £49.60 to Hotchoc
d.
£49.60 to Gelato; £30.40 to Hotchoc
The correct answer is d.
Discussion
The £80 invested in shares will consist of £49.60 allocated to Gelato (62% of £80) and £30.40 allocated to Hotchoc (38% of £80). This is the most efficient (optimal) combination of shares.

