10 The growing world PV market
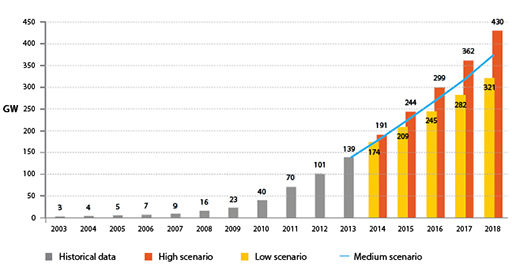
Since the beginning of the 21st century world installed PV capacity has grown extremely, from some 1.5 GW in 2000 to just under 306.5 GW in 2016. Before 2010 most of the expansion occurred in the EU but in recent years China, Taiwan and India have become the main engines of growth with China alone expected to reach nearly 200 GWp installed capacity by 2021 but with significant increases in all regions. Ironically the trailblazer, Europe, has fallen behind in recent years though a combination of the need to reach the EU 2020 renewable energy targets, renewed commitments under the Paris accords and the rapid reduction in cost is expected to lead to a new growth phase in most European states over the next few years.
Crystalline silicon still dominates PV technology in the marketplace, and in 2015 monocrystalline and polycrystalline modules accounted for some 93% of world production, with almost all the remainder consisting of thin-film technologies such cadmium telluride (CdTe). However significant developments in both cell technologies and manufacturing processes hold the potential for greater flexibility and higher efficiency at a lower cost, so this hegemony may not last much longer. (IRENA, 2017)
Medium-term projections of the world PV market by Solar Power Europe (formerly the European Photovoltaics Industry Association) suggest that strong growth is likely to continue, resulting in between 625 GW and 930 GW of installed capacity by 2021 (see Figure 15). Much of this growth will be driven by newly emerging markets such as India and Brazil, and even though the growth of the PV market in China is expected to slow, the country is still expected to add 120 GW capacity between 2017 and 2021, giving it more than one fifth of the world’s total. ) (Solar Power Europe, 2017).

Looking much further ahead, to 2050, the International Energy Agency, in its 2014 Energy Technology Perspectives report (IEA, 2014) has produced a number of ‘Two Degree Scenarios’ (2DS) illustrating the measures the world needs to adopt if the increase in global surface temperature is to be limited to two degrees. In one of these, the Two Degree High Renewables (2DS hi-Ren) scenario shown in Figure 16, the share of PV electricity generation capacity rises to over 6 000 terawatt hours, supplying some 18% of projected world electricity, by 2050.

Long-term expert projections such as those of the SolarPower Europe, the IEA, and in the UK the Climate Change Committee, are subject to a very wide range of uncertainty.
Nevertheless, the future prospects of photovoltaics as a clean, renewable source of energy for the world by mid-century do seem bright.
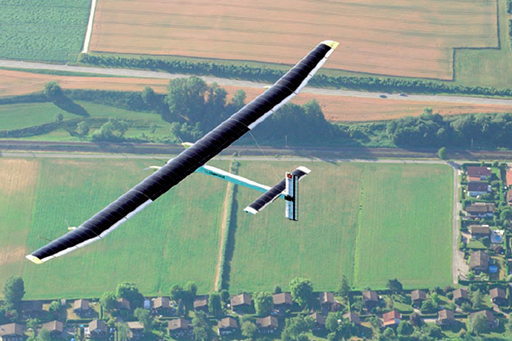
For an inspiring – and literally uplifting – symbol of the rising hopes of the global PV industry: have a look at the ‘Solar Impulse’ project shown in Figure 17. This solar PV-powered single-seat aircraft is powered by some 11 625 monocrystalline PV cells of 22% efficiency, mounted on the wings and tail. Four 7.5 kW electric motors drive the propellers and electrical storage is provided by lithium polymer batteries. From its maiden flight in 2009 the aircraft successfully completed flights of increasing duration in Europe before finally achieving the ultimate aim of a PV-powered round-the-world flight in 2016.
The leaders of the project, Bertrand Piccard and André Borschberg, don’t see PV powered aircraft replacing conventional aircraft in the foreseeable future. On landing after Solar Impulse’s first international flight, Piccard indicated that the project’s goal was not to cause a revolution in aviation: its aim was to promote a revolution in the mindset of people when they think about renewable energy, energy saving and new technologies (Solar Impulse Foundation, 2016)
Next you can have a go at the Week 3 quiz.

