3 World hydro output
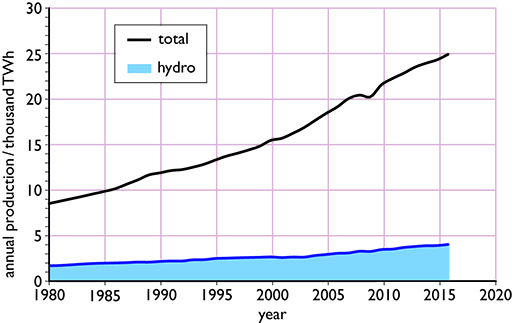
By 1900, after twenty years of commercial hydroelectricity, world annual output had reached an estimated 3.7 TWh from an installed capacity of about 1.3 GW. Despite two world wars and the depression of the 1930s, world capacity then rose at an annual rate of nearly 10% per year throughout the first half of the twentieth century, leading to an output in 1950 that was nearly a hundred times that of 1900. Since then, as shown in Figure 4, fairly constant year-on-year increase of 50 TWh in annual output throughout the second half of the century was maintained, though in 2001 output fell by about 5% despite a further rise in installed capacity – an anomaly attributed to unusually dry conditions in the Americas, the source of about a third of world output.

A fairly constant year-on-year increase of 50 TWh in annual output throughout the second half of the century was maintained, but in 2001 output fell by about 5% for the first time, despite a further rise in installed capacity. The drop was attributed mainly to exceptionally dry conditions in the Americas, the source of about a third of world output. The next year, 2002, was mixed.
The years from 2003 have shown a renewed rapid increase, with world output increasing by a total of 1500 TWh over the twelve years to 2015. Assuming that the average capacity factor remained at about 43%, this implies an increase of about 75 GW in hydro capacity. This period saw growing contributions from the world’s two largest hydro plants, Three Gorges in China and Itaipú in Brazil.
But what about hydro on a small scale? You’ll move onto that subject next.
