

1 The origins of wind and atmospheric pressure
As mentioned in Week 2, 1m2 of the Earth’s surface on or near the equator receives more solar radiation per year than 1m2 at higher latitudes. The curvature of the Earth means that its surface becomes more oblique to the Sun’s rays with increasing latitude. Also, the Sun’s rays have further to travel through the atmosphere as latitude increases, so more of the Sun’s energy is absorbed en-route before it reaches the surface. As a result, the tropics are warmer than higher latitude regions. This differential solar heating of the Earth’s surface causes variations in atmospheric pressure, which in turn give rise to the movements of atmospheric air masses that are the principal cause of the Earth’s wind systems.
What is atmospheric pressure?
It’s the pressure resulting from the weight of the column of air above a specified surface area. The unit of atmospheric pressure is the bar. It is measured using a barometer – a device usually calibrated in millibars (mbar), i.e , thousandths of a bar.
The average atmospheric pressure at sea level is about 1013.2 mbar (approximately 1 bar).
On the weather maps featured in television weather forecasts or in newspapers, there are regions marked ‘high’ and ‘low’, surrounded by contours shown in Figure 1.
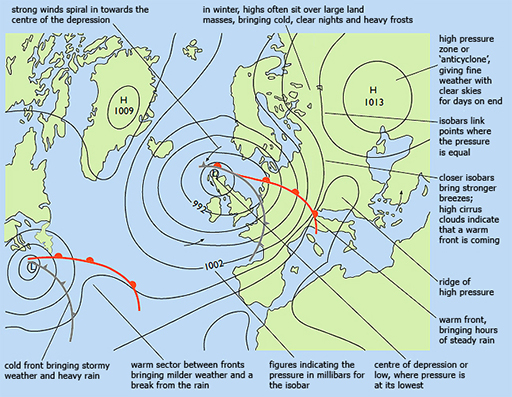
The regions marked ‘high’ and ‘low’ relate to the atmospheric pressure and the contours represent lines of equal pressure called isobars. The high-pressure regions tend to indicate fine weather with little wind, whereas the low-pressure regions indicate changeable windy weather and precipitation (rain or snow).
Next you’ll look at how to work out the energy and power in the wind.