

5 Power and energy from wind turbines
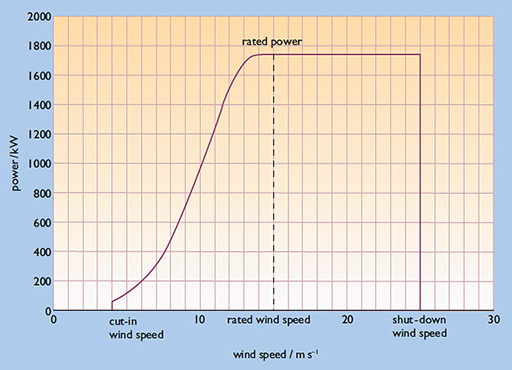
The power output of a wind turbine varies with wind speed. Every turbine has a characteristic wind speed–power curve, often simply called the power curve, shown in Figure 9.
The energy a wind turbine will produce depends on both its wind speed–power curve shown in Figure 9 and the wind speed frequency distribution shown in figure 10 at the site.
The cut-in wind speed, shown in figure 9, is the wind speed below which the turbine does not rotate and generate power. Above the cut-in wind speed, the torque generated by air flow overcomes the frictional torques inherent in the mounting assembly of the turbine blades.
The shut-down wind speed is the wind speed at which the turbine has to be locked down to avoid damage due to excessive centrifugal forces and other mechanical stresses.
The range of wind speeds between cut-in and shut-down is called the operating range of the turbine.
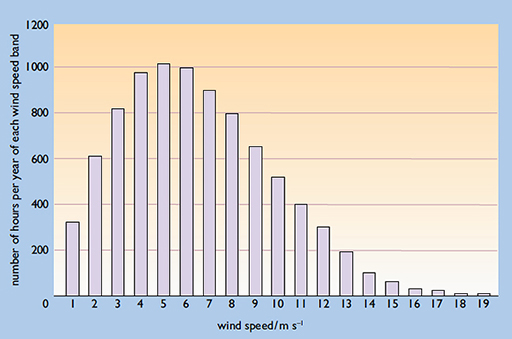
Using the data from these graphs enables us to calculate a wind energy distribution graph, which you’ll examine next section.