4 Biodiversity patterns
The rich diversity of life on Earth has fascinated humans for thousands of years, and new species are still being discovered and named. But how many species are there in the world? This section attempts to explore this diversity, starting with this video news item [Tip: hold Ctrl and click a link to open it in a new tab. (Hide tip)] from the BBC
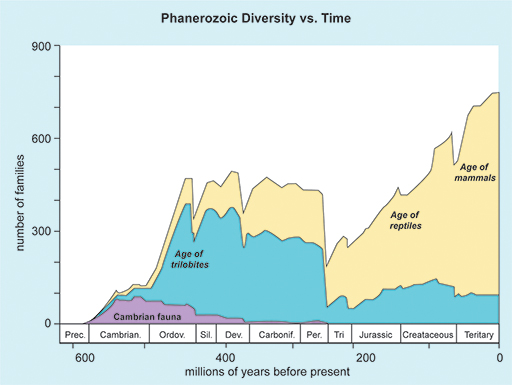
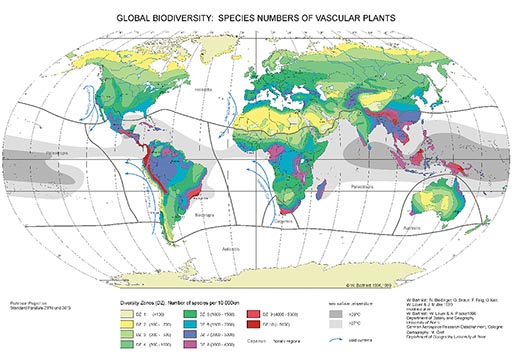
Estimating the number of species on our planet is a tough challenge with contentious estimates ranging from 10 million to well over a trillion. However, one thing scientists agree on is the fact that the pattern of biodiversity distribution in the world is not even, both in space (for example, think of geographical distribution, e.g. Figure 10) and time (for example, the various levels of biodiversity during Earth’s geological ages shown in Figure 11). You may notice in Figure 10 that, at this point in time, the highest biodiversity of Earth’s vascular plants lies in the tropics and the lowest is in the higher latitudes. Figure 11, however, shows that Earth’s biodiversity hasn’t always been the same. There have been times, for example, when biodiversity declined (called periods of mass extinction – e.g, when the dinosaurs died out). The map also shows a rapid increase in the biodiversity of flowering plants.
In Figure 10, there is a distinct pattern of high biodiversity in the tropics and other localities (shown in red), some of which have even higher biodiversity. These localities are called biodiversity hotspots in recognition of their high diversity and the particular threat of destruction in their region.

Activity 5 Diversity through time
Considering the change in biodiversity (i.e. number of families) through time shown in Figure 11, can you spot and name instances of rapid biodiversity decline (i.e. mass extinctions)?
Answer
In Figure 11 it is possible to see at least five instances of mass extinction, i.e. the levels where biodiversity shows a downward dip along the y axis (number of families). The most well-known instances and their times (recorded in millions of years ago, or Ma) are:
- the Cretaceous–Palaeogene extinction event at the end of the Cretaceous Period (66 Ma)
- the Triassic–Jurassic extinction event at the end of the Triassic Period (201.3 Ma)
- the Permian–Triassic extinction event at the end of the Permian Period (252 Ma)
- the late-Devonian extinction event (375–360 Ma)
- the extinction events at the end of the Ordovician Period (450–440 Ma)
Note that there could be more extinction events than these and the time scales recorded here are approximate.
After completing Activity 5, you should recognise that, in any discussion of biodiversity, the framework of geographic and time scales must first be considered. For example, imagine you were noting the prevalence of the Canary laurel (Laurus novocanariensis) in the uplands of Tenerife (the largest island in the Canary Islands archipelago). While it might be correct to state that this plant is on the increase, it might also be the case that the species has only recently been able to spread up to the formerly cool higher altitudes of the same island due to a warming climate. Or one might observe that the Canary Islands stonechat (Saxicola dacotiae) has disappeared from Lanzarote (formed 15 million years ago) only to be found on the more recently formed island of El Hierro (formed 1.2 million years ago), thus showing a change in the bird’s distribution over time. However, as with the previous example, it is worth noting that spatial and temporal patterns sometimes overlap and the picture might not be always clear. Nevertheless, such patterns are abundant in nature and follow either or both of the two scales. These patterns will be explored in detail in the following sections.

