

2 Image analysis
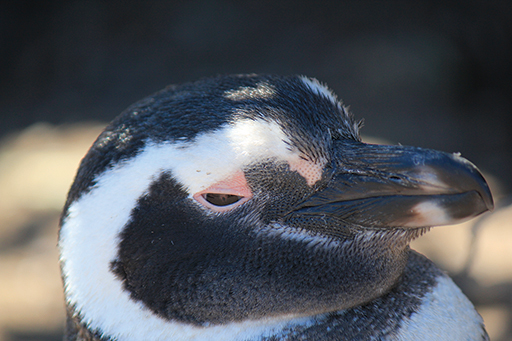
Birds are widely distributed, are often highly visible and vocal, and readily attract our interest (Figure 1). As a consequence, data sets on bird diversity are generally much more comprehensive than those for other animals. Surveys of birds usually collect five pieces of data: species identity, where the bird was seen, the date on which it was seen, what it was doing and how many others of the same species were seen at the time of observation.
There are also five common surveying techniques: territory mapping, transects, point counts, flock or roost counting, and remote sensing such as satellite imaging.
Many of the examples of citizen science that you have encountered so far have involved observations or collections made in the field. However, there are projects that harness the observational skills of citizen scientists in the analysis of photographs, video recordings and live camera feeds. Here is a look at one such bird-related study.
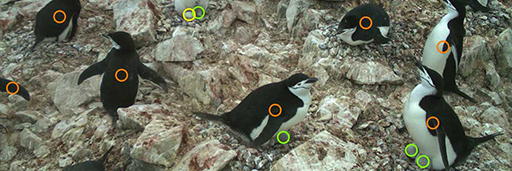
Penguin colonies are found around the Southern Ocean and, as penguins are predators, the health of these colonies is an important indicator of the state of the marine ecosystem. Their geographical range is huge and the habitats they occupy are challenging for observers. PenguinWatch [Tip: hold Ctrl and click a link to open it in a new tab. (Hide tip)] is a citizen science project that has set up a network of cameras on South Atlantic islands and the Antarctic peninsula to monitor penguin colonies all year round. The health of the colonies can be assessed by looking at survival rates of chicks and overall numbers in each colony. Extracting data from the cameras is a time-consuming process, which will eventually be automatic, but at present it is done by over 47,000 volunteers who access the camera images online, marking the adults, chicks and eggs they observe in each image with different-coloured circles. In the image shown in Figure 2, the adults are marked with an orange circle, the chicks with green and the eggs with yellow. There are only six species that might be encountered in the images, but other animals are sometimes visible, so species identification skills are required.
Activity 2 Using image analysis
Now it’s time to try image analysis for yourself. First, go to the PenguinWatch website and click on ‘Get started’. You will then be able to view the short tutorial, after which you will be presented with your first image. (Be prepared to encounter images that are devoid of animal life or obscured by weather.) When you have a feel for the process, think about what information might be extracted from the data set that is being accumulated.
Answer
As the cameras are active all year round, changes in the colony over time – for example, hatching dates – will be observed and can be compared with previous years. Predators will be observed and it will be possible to identify them and work out the rate of predation of chicks and whether predation patterns are changing from year to year. You might also have mentioned arrivals and departures, together with how many penguins, if any, overwinter in the area.