4 Summary
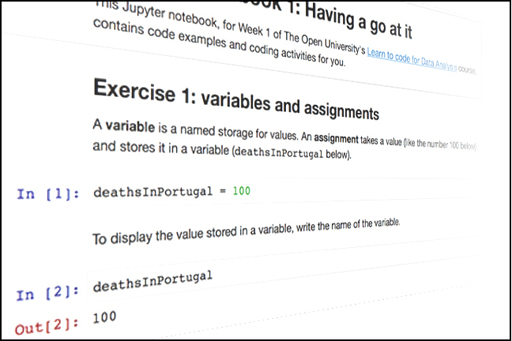
This week you used Jupyter notebooks to write and execute simple programs with Python and the pandas module. You've learned how to:
- load a table from an Excel file
- select a column, and compute some simple statistics (like the total, minimum and median) about it.
- create a new column with values calculated from other columns
- sort a table by one of its columns.
Next week you will learn further ways to manipulate dataframes, in particular to clean data. You will also produce your first data chart, showing variations of values over time.

