

1.4 Filtering groups
Being able to group rows according to some criterion and then apply various operations to those groups is a very powerful technique.
However, there may be occasions when you only want to work with a subset of the groups that can be extracted from a single dataset based on a particular group property. For example, it might require that:
- groups that contain a minimum number of rows, such as countries that engage in trade around a particular commodity with a minimum number of partner countries
- groups for whom a summary statistic meets certain conditions (for example, the total value of exports for a particular commodity exceeds a particular threshold value, or whose minimum or maximum value are below a certain value)
- a ranking of the groups based on a particular summary statistic, such as the total trade value, that returns only the top five or bottom three groups according to that ranking.
In the following example, where groups are selected based on group size, a filtering operation is applied to limit an original dataset so that it includes just those groups containing at least three rows, combining the rows from the selected groups back together again to produce the output dataset:
In pandas, groups can be filtered based on their group properties using the filter() method. Using the example dataframe again:
In []:
df
Out[]:
| Commodity | Amount | |
|---|---|---|
| 0 | A | 10 |
| 1 | A | 15 |
| 2 | A | 5 |
| 3 | A | 20 |
| 4 | B | 10 |
| 5 | B | 10 |
| 6 | B | 5 |
| 7 | C | 20 |
| 8 | C | 30 |
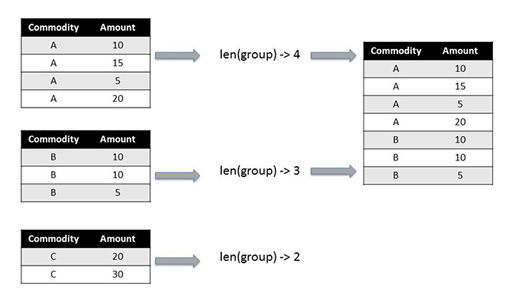
For example, the dataframe can be filtered to return just the rows from groups where there is a maximum number of rows in the group.
As a reference point, count how many rows are associated with each group.
In []:
grouped = df.groupby('Commodity')
grouped.aggregate(len)
Out[]:
| Amount | |
|---|---|
| Commodity | |
| A | 4 |
| B | 3 |
| C | 2 |
The filter() method uses a function that returns a boolean ( True or False ) value to decide whether or not to filter through the rows associated with a particular group.
As with the apply() method, provide the filter() method with just a function name in order to pass each group to that function. For example, define a function that says whether or not a group contains three or fewer rows and use that as a basis for filtering the original dataset.
In []:
def groupsOfAtMostThreeRows(g):
return len(g) <= 3
grouped.filter(groupsOfAtMostThreeRows)
Out[]:
| Commodity | Amount | |
|---|---|---|
| 4 | B | 10 |
| 5 | B | 10 |
| 6 | B | 5 |
| 7 | C | 20 |
| 8 | C | 30 |
Alternatively, all the rows in a group can be filtered on an aggregate property of the group such as the sum total, or maximum, minimum or mean value, from one of the columns.
In []:
#Consider the following total amounts by group
grouped.aggregate(sum)
Out[]:
| Amount | |
|---|---|
| Commodity | |
| A | 50 |
| B | 25 |
| C | 50 |
In []:
pivot_table(df,
index=['Commodity','Partner'],
values='Amount',
aggfunc=sum)
Out[]:
| Commodity | Amount | |
|---|---|---|
| 0 | A | 10 |
| 1 | A | 15 |
| 2 | A | 5 |
| 3 | A | 20 |
| 7 | C | 20 |
| 8 | C | 30 |
The ability to filter datasets based on group properties means that large datasets can more easily be limited to just those rows associated with groups of rows that are deemed to be relevant in some way.
Exercise 4 Filtering groups
Use the Exercise notebook 4 to practise filtering in Exercise 4.
As you complete the tasks, think about other questions you could ask of your data using the filter command.