

1.4 Tally charts and frequency charts
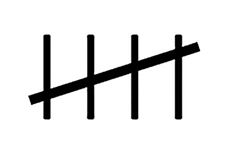
Tallying is a way of recording data in groups of five.
Recording frequencies in this way means totalling the number of tally marks made (figure 1).
Tally charts can be used to collect and organise primary data.
Look at the tally chart in Figure 2.
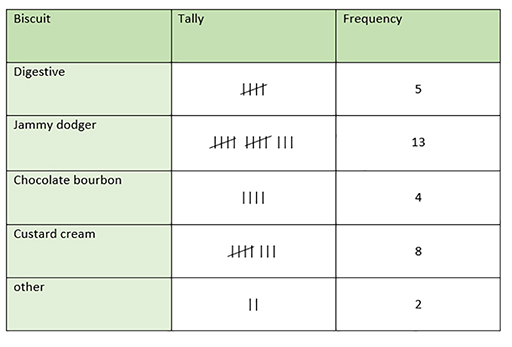
The first column contains all of the possible data options. Note that there is an ‘other’ box in case any of the answers do not fit into the first four categories. As with questionnaire questions, it is important that every possible answer can be recorded in a data collection table such as this one.
The second column is for a tally, so that results can be recorded and added to.The final column is the frequency. This is the total for each data category once all the data has been collected.
It is also possible to have a frequency chart without a tally column, like the example shown below.
| Flavour | Frequency |
| Chocolate | 14 |
| Vanilla | 5 |
| Strawberry | 7 |
| Other | 20 |
Activity 3 Reflecting
Did you notice that the ‘Other’ category in the example above had the highest frequency?
What conclusions could you draw from this?
Discussion
Sometimes when collecting data, the results can be surprising. Participants sometimes give answers you do not expect.
It may be that there are popular icecream flavours that have not been listed.
In some instances, it is worth introducing further categories once some initial data has been collected.