1.9 Stem and leaf diagrams
As well as recording data in frequency tables, results can be recorded and presented in a stem and leaf diagram. This visual representation allows for the data to be grouped in classes and it shows the shape of the data.
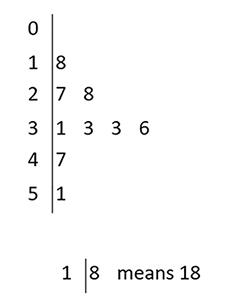
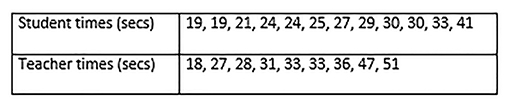
A group of students challenged their teachers to a speed-texting competition. The 21 participants (12 students and 9 teachers) were each required to send a short text message on a mobile phone. Their times are given in Figure 3 in order of size.
Creating a stem and leaf diagram involves finding the ‘stems’, in this case the tens, and then recording the ‘leaves’ in order.
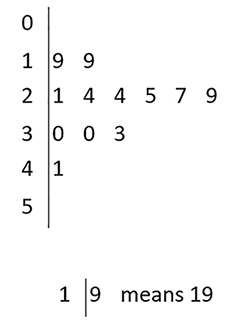
The stem and leaf diagram for the student times is shown in Figure 4. You can see that 1|9 represents 19 and 4|1 represents 41. There are no values between 0 and 10 which is shown as there are no leaves next to the stem 0. The greatest value in this data set is 41, so there are no values next to the stem 5 either.