

3.3 Scatter graphs
So far this week, you have mainly focused on graphs and charts which are used to display single variables.
In this section you will consider bivariate data, which will involve looking at data for two variables at once. One example would be to look at the sales of umbrellas per day alongside the hours of rainfall per day.
Scatter graphs show the relationship between two sets of variables. By looking at a scatter graph you can see whether there is a link between two variables.
When there is a link it is called correlation.
Correlation
Scatter graphs can have positive correlation, negative correlation, or no correlation.
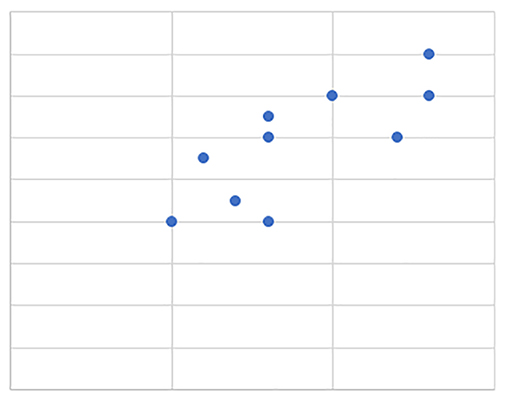
Positive correlation means as one variable increases, so does the other variable (Figure 26). They have a positive connection.
For example: as it snows more, sales of de-icer sprays go up.
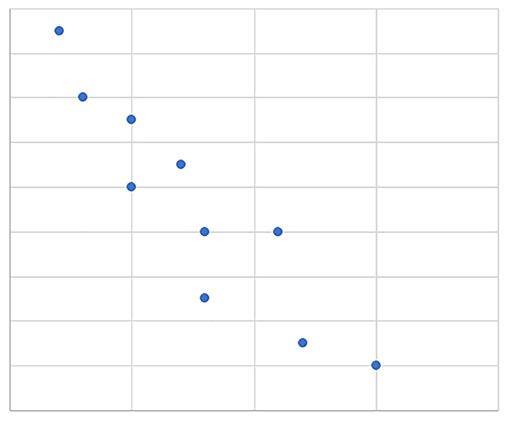
Negative correlation means as one variable increases, the other variable decreases (Figure 27). They have a negative connection.
For example: as the temperature increases, fewer hot chocolate products are sold.
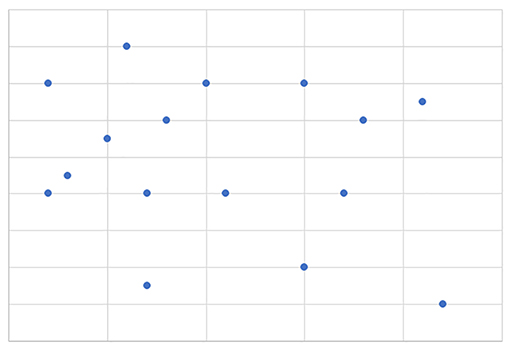
No correlation means there is no connection between the two variables (Figure 28).
For example: an increase in rainfall in the UK and the sales of bananas in supermarkets.
Activity 14 Expected correlation
Would you expect there to be a positive correlation, a negative correlation, or no correlation between the following pairs of variables?
- a.age and weight
- b.cold drinks sales and temperature
- c.height and intelligence
Discussion
- a.In children, you might expect a correlation between age and weight but with adults, you would not expect a correlation.
- b.Yes, in hot weather, people are more likely to buy cold drinks.
- c.No, there is no relationship between height and intelligence.